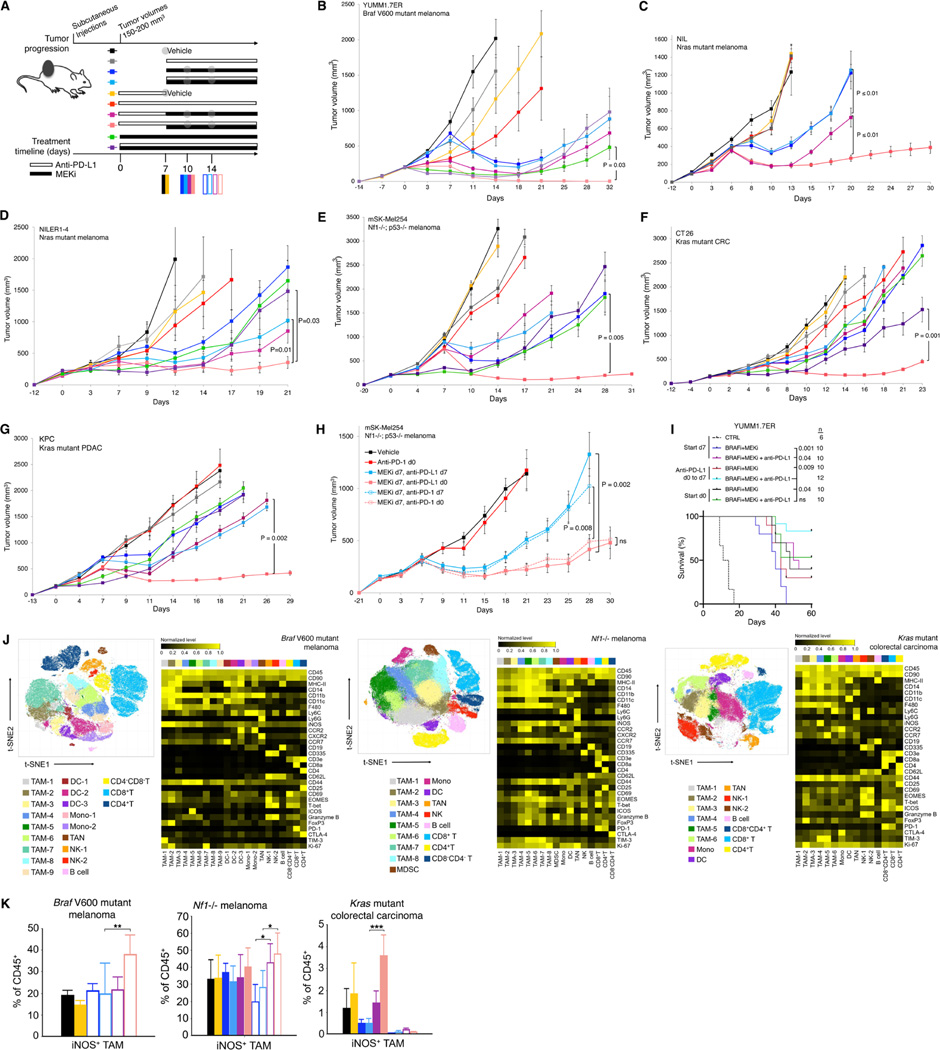
Figure 2. Two doses of anti-PD-1/L1 before MAPKi combination forestall therapy resistance and induce pro-inflammatory TAM polarization.
(A) Schematic of timelines for subcutaneous tumor progression and for dosing anti-PD-L1 and/or MEKi therapies in (B to I) and for tumor sampling in (J and K). Anti-PD-L1 (200 μg/mouse) twice per week IP; MEKi (dosage variable depending on the tumor model) daily PO via chow. Gray circles indicate regimen and time points for CyTOF analysis in Figure 2 and scRNA-seq + scTCR-seq analysis in Figure 3.
(B to H) Tumor volumes of YUMM1.7ER (B), NIL (C), NILER1–4 (D), mSK-Mel254 (E, H), CT26 (F), and KPC (G) treated with indicated regimens in (A). Trametinib at 1 (B, C, D), 2 (G), 3 (E) or 5 (F) mg/kg/d PO via chow. Anti-PD-L1 (200 μg/mouse) and anti-PD-1 (300 μg/mouse first week only and then 200 μg/mouse) twice per week IP. N = 8 tumors/group. Data are means ± SEMs (P-values, Student’s t test) and representative of two independent experiments.
(I) Overall survival (cutoff tumor volume ≥ 1000 mm3) of mice bearing YUMM1.7ER tumors treated as indicated. PLX4032, 50 mg/kg/d PO; trametinib, 0.3 mg/kg/d PO. CTRL, historical control. All p-values (logrank test) are for pairwise comparisons relative to mice treated with anti-PD-L1 (d0 to d7) followed by the triplet (anti-PD-L1 + PLX4032 + trametinib) combination.
(J) t-SNE maps (left) of tumor-infiltrating CD45+ cells analyzed by CyTOF in three indicated syngeneic subcutaneous tumor models at time points and in treatment regimens indicated in (A). Heatmaps (right) showing the expression values of immune phenotypic protein markers normalized to the maximum mean value across subsets.
(K) Frequencies of iNOS+ TAMs in the CD45+ population of three syngeneic tumor models at time points and treatment regimens indicated in (A). Mean ± SEMs. Pairwise comparisons were performed in (i) vehicle vs. two doses of anti-PD-L1, (ii) MEKi d7 vs. MEKi d7, anti-PD-L1 d0 to d7, (iii) MEKi d7, anti-PD-L1 d7 vs. MEKi d7, anti-PD-L1 d0. P-value, Student’s t test. *p < 0.05, **p < 0.01 and ***p < 0.001. See (A).
See also Figure S2.

