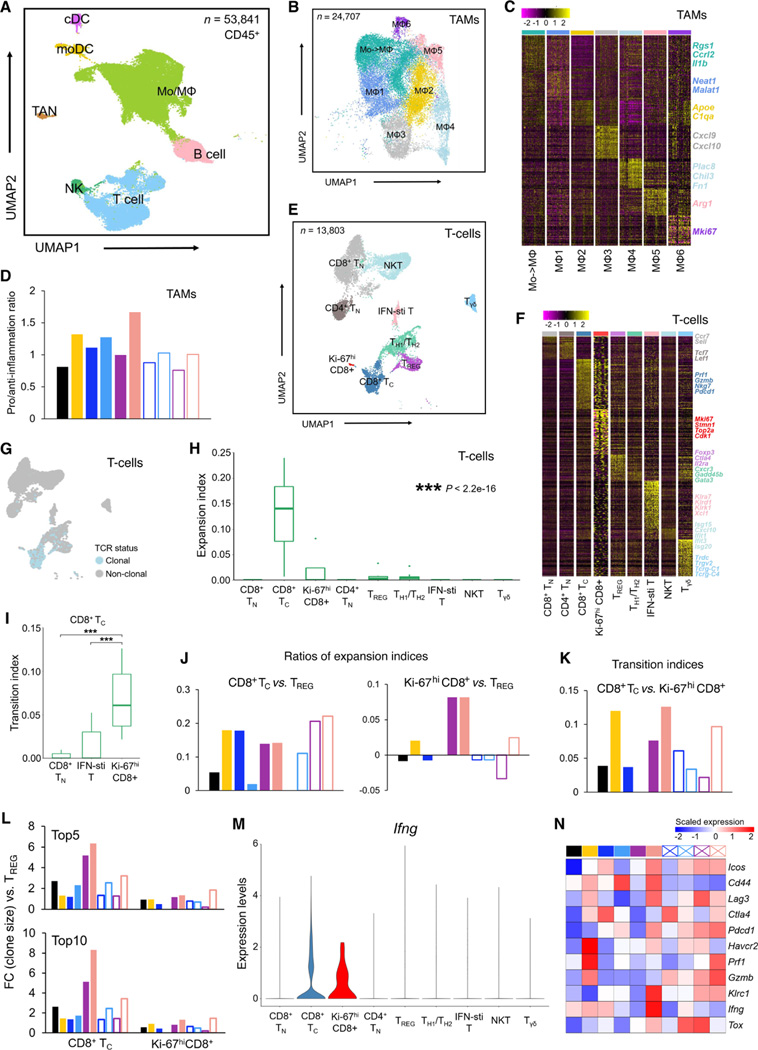
Figure 3. TAM and T-cell phenotypes associated with response to optimized therapy regimen.
(A) Uniform manifold approximation and projection (UMAP) of tumor-infiltrating CD45+ cells (n = 53,841) analyzed by scRNA-seq. Dissociated live, CD45+ cells were pooled from 4 tumors (mSK-Mel254) per regimen and per time point. Inferred cell types are indicated by clusters denoted by distinct colors.
(B) UMAP of tumor-infiltrating Mo/MΦ population (n = 28,857) analyzed by scRNA-seq. Clusters with differentially expressed genes are denoted by distinct colors.
(C) Heatmap showing differentially expressed genes (rows) among different Mo/MΦ subpopulations (columns). Representative genes of each cluster are highlighted (right).
(D) Ratios between the proportions of pro- and anti-inflammatory MΦ clusters across distinct regimens and time points. See Figure 2A.
(E) UMAP of tumor-infiltrating T cells (n = 13,803) analyzed by scRNA-seq. Clusters with differentially expressed genes are denoted by distinct colors.
(F) Heatmap showing differentially expressed genes (rows) among different T-cell clusters (columns) and highlighted genes of each cluster (right).
(G) UMAP in (E) colored by clonality based on scTCR-seq.
(H) Clonal expansion indices of T-cell subpopulations. P-value, Kruskal–Wallis test.
(I) Developmental transition indices of CD8+ TC cells with other CD8+ subpopulations. Pairwise comparisons were performed between Ki-67hi CD8+ T cells and each of the other CD8+ subpopulations with the Wilcoxon test. P-values, ***p < 0.001.
(J) Relative expansion ratios between TC vs. TREG (left) and Ki-67hi CD8+ vs. TREG (right) across different treatment regimens and time points. See Figure 2A.
(K) Developmental transition indices between CD8+ TC and Ki-67hi CD8+ T cells across distinct regimens and time points. See Figure 2A.
(L) Fold changes of top 5 (top) or 10 (bottom) clone sizes for CD8+ TC or Ki-67hi CD8+ T cells vs. CD4+ TREG cells. See Figure 2A.
(M) Violin plots of Ifng expression in distinct T-cell subpopulations.
(N) Heatmap displaying the scaled mean expression levels of highlighted functional genes (rows) in TC cells across treatment regimens and time points (see Figure 2A). Gene expression levels were row-scaled for only TC cells.

