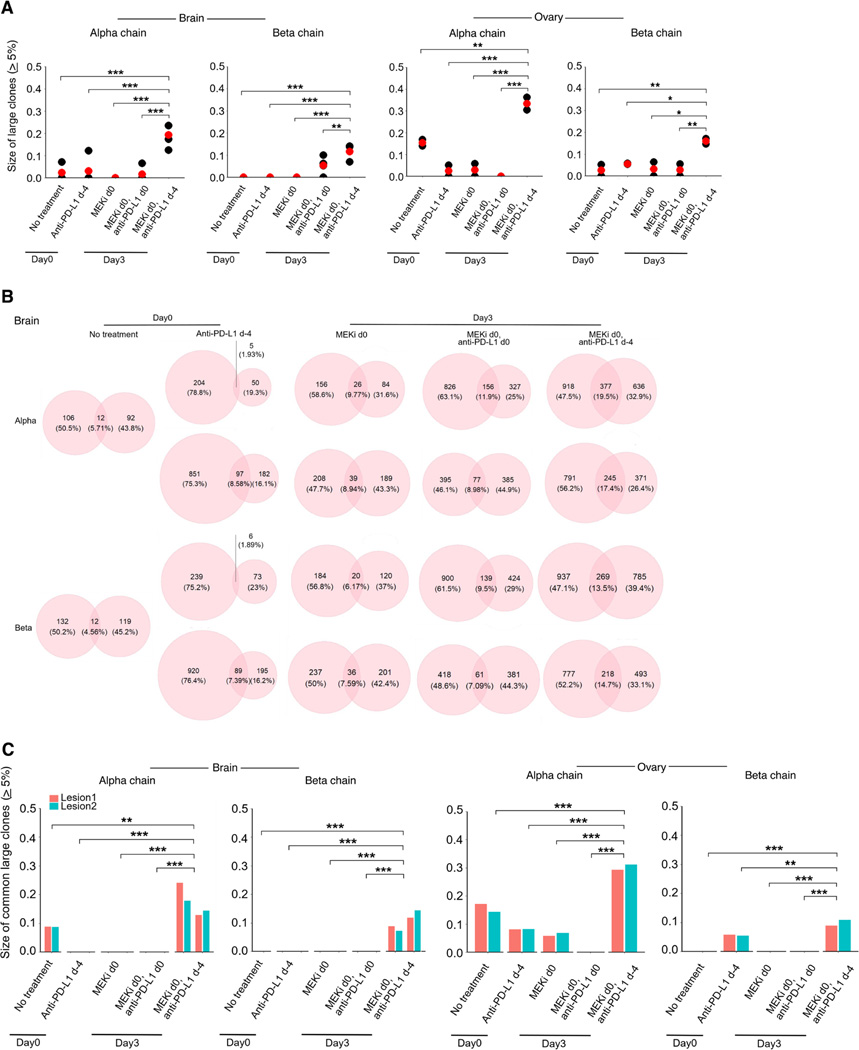
Figure 6. Anti-PD-L1 lead-in before MAPKi co-treatment augments clonal T-cell expansion.
(A) Tumor cell-involved brain and ovarian tissues were collected from mice at time points and in groups as indicated in Figure 5A (brain, n = 2 mice per group, except the no treatment group; ovary, n = 1 mouse per group; two geographically distinct regions of each organ site were sampled for TCR-seq analysis). The total sizes of large TCR clones (≥ 5%) for the α or β chain in tumor-involved brain or ovarian tissues (red dots, average values). Pairwise comparisons were performed between the group of MEKi d0, anti-PD-L1 d-4 vs. each of the other groups with Student’s t-test. P-values, *p < 0.05, **p < 0.01, ***p < 0.001.
(B) The fractions of overlapping TCR clones (α or β chain) between two distinct geographic regions of tumor-involved brain tissues from individual mice.
(C) Total sizes of large clones (≥ 5%) shared by two distinct geographic regions of tumor-involved brain or ovarian tissues in each mouse. Pairwise comparisons were performed as in (A).
See also Figure S4.

