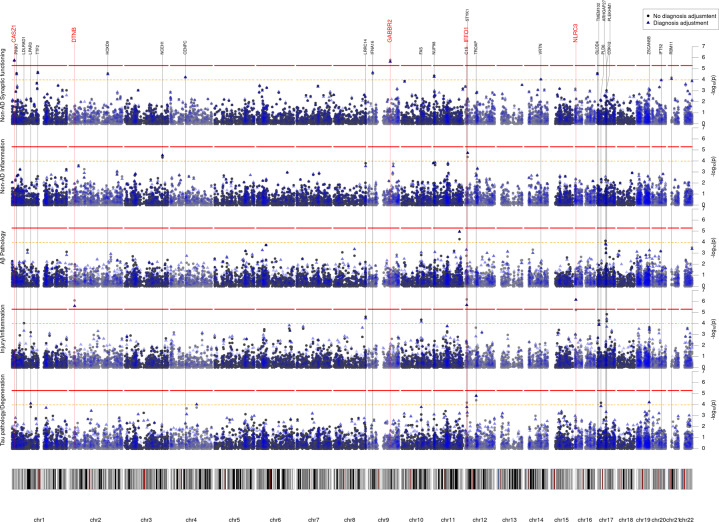
Fig. 1. Manhattan plot of the exome-wide rare variant anayses (protein-coding).
Results from the exome-wide rare variant (MAF < 1%) analyses of five CSF biomarker principal components (PC) (n = 480). Each plot displays a different PC as outcome. X-axis represents each gene (rare protein-coding variants) and the y-axis the p value obtained from gene-based SKAT-O tests on a −log10 scale. All analyses were adjusted for sex, age, and genetic ancestry. Blue points represent p values additionally adjusted for diagnosis. Red line indicates exome-wide significance threshold (p = 5.2 * 10−6). Yellow line indicates suggestive threshold (p = 1.0 * 10−4). Exome-wide significant genes are highlighted with a larger and red font.

