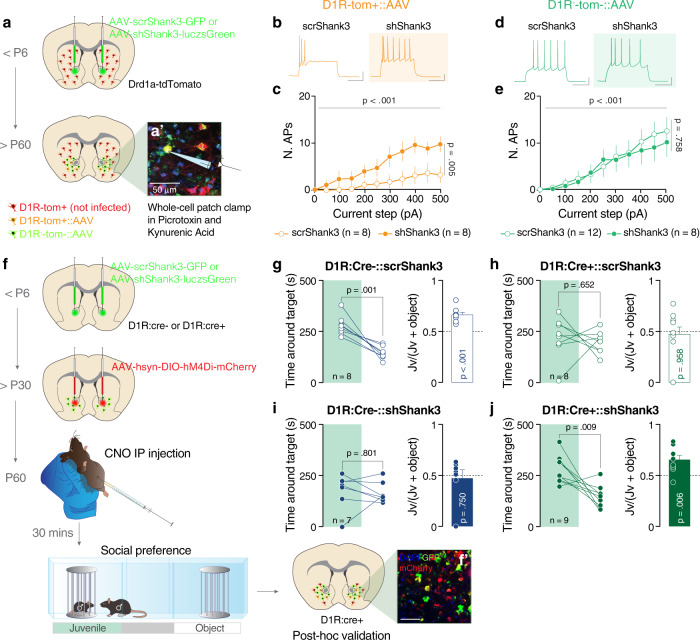
Fig. 2. Shank3 NAc downregulation alters D1R MSNs excitability. Decreasing the activity of D1R MSNs normalizes sociability deficits.
a Experimental design. Drd1a-dTomato mice were injected neonatally in the NAc with scr or shShank3 virus and whole-cell patch clamp recordings were performed during early adulthood. a′ Representative image of the NAc of a D1R-tom+::shShank3 mouse (scale bar: 50 µm). b Example traces at 300 pA depolarizing current injection in D1R-tom+ MSNs infected with scrShank3 (left) or with shShank3 (right). c Number of action potentials (nAPs) across increasing depolarizing current steps (0-500 pA) for D1R-tom+::scrShank3 and shShank3 MSNs, in presence of picrotoxin and kynurenic acid (repeated measures two-way ANOVA, virus main effect F(1, 14) = 10.88, p = 0.005, current steps main effect F(10, 140) = 7.727, p < 0.001, virus x current step interaction F(10, 140) = 1.626, p = 0.1051, scrShank3 n = 8 cells, 3 mice, shShank3 n = 8 cells, 3 mice). d Example traces at 300 pA depolarizing current injection in D1R-tom- MSNs infected with scrShank3 (left) or with shShank3 (right). e Number of action potentials (nAPs) across increasing depolarizing current steps (0−500 pA) for D1R-tom−::scrShank3 and shShank3 MSNs, in presence of picrotoxin and kynurenic acid (repeated measures (RM) two-way ANOVA, virus main effect F(1,18) = 0.098, p = 0.758, current steps main effect F(10, 180) = 14.58, p < 0.001, virus x current step interaction F(10, 180) = 0.3254, p = 0. 9736, n = 8 cells, 3 mice (sh), n = 12 cells, 3 mice (scr)). f Experimental design. D1R-Cre positive (D1R:Cre+) and negative (D1R:Cre−) mice were injected neonatally in the NAc with scr or shShank3 virus and after P30 with AAV-hSyn-DIO-hM4Di-mCherry (DREADD). After 4 weeks, allowing for virus expression, the mice underwent social behavior assessment in the three-chamber task. All mice were intraperitoneally injected with CNO 30 min before starting the test. f′ Representative image of the NAc of a D1R:Cre+ mouse infected with shShank3 and DREADD viruses (scale bar: 50 µm). Left: time around the target during the social preference test for D1R:Cre-::scrShank3 mice: paired-samples t-test for object- vs. social: g t(7) = 5.453, p = 0.001; D1R:Cre+::scrShank3 mice, paired-samples t-test for object- vs. social: h t(7) = 0.471, p = 0.652; D1R:Cre−::shShank3 mice, paired-samples t-test for object- vs. social: i t(6) = 0.264, p = 0.801 and D1R:Cre+::shShank3 mice, paired-samples t-test for object- vs. social: j t(8) = 3.443, p = 0.009. Right: juvenile preference index (one-sample t-tests against chance level = 0.5: D1R:Cre−::scrShank3; t(7) = 6.395, p < 0.001, D1R:Cre+::scrShank3; t(7) = 0.054, p = 0.958, D1R:Cre−::shShank3; t(6) = 0.334, p = 0.750, D1R:Cre+::shShank3; t(8) = 3.706, p = 0.006). Error bars report SEM.

