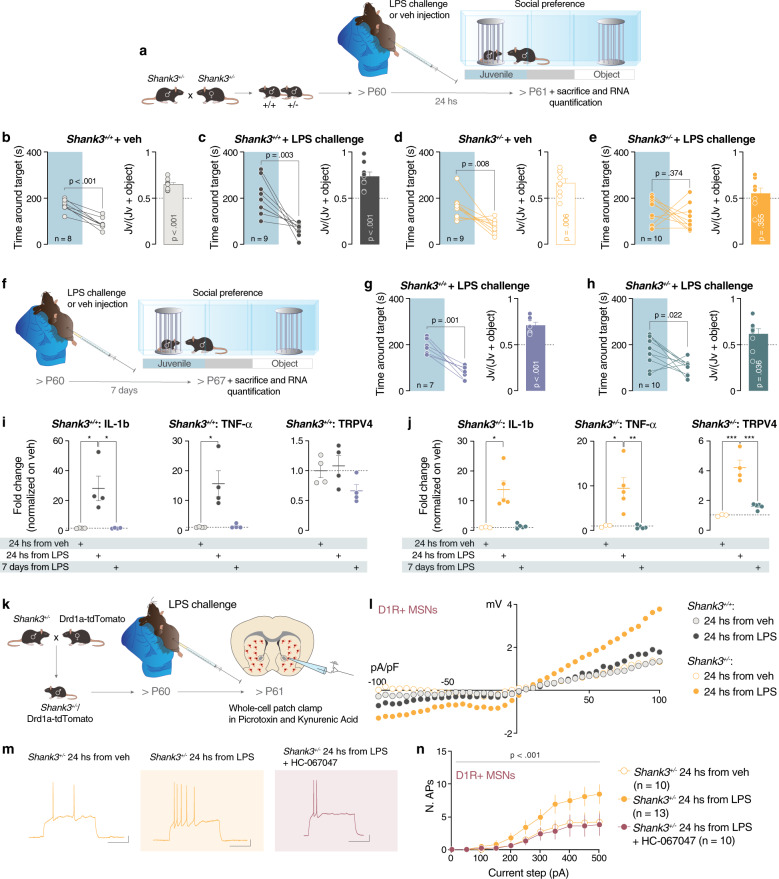
Fig. 4. LPS challenge in Shank3+/− unmasks social deficits.
a Experimental design. Shank3+/+ and Shank3+/− were intraperitoneally injected with LPS or vehicle and 24 h later they were subjected to the three-chamber task. Left: Time spent around the target (paired-samples t-tests for object- vs. social: b t(7) = 7.686, p < 0.001; c t(8) = 4.199, p = 0.003; d t(8) = 3.462, p = 0.008; e t(9) = 0.935, p = 0.374). Right: juvenile preference index (one-sample t-tests against chance level = 0.5: b t(7) = 7.2, p < 0.001; c t(8) = 5.262, p < 0.001; d t(8) = 3.734, p = 0.006; e t(9) = 0.9747, p = 0.355). f Experimental design. Shank3+/+ and Shank3+/− were intraperitoneally injected with LPS and 7 days later were subjected to a three-chamber task. Left: Time spent around the target (paired-samples t-tests for object- vs. social: g t(6) = 5.979, p = 0.001; h t(9) = 2.759, p = 0.022). Right: juvenile preference index (one-sample t-tests against chance level = 0.5: g t(6) = 6.054, p < 0.001; h t(9) = 2.463, p = 0.036). i mRNA expression analysis of IL-1β, TNF-α and Trpv4 genes after LPS challenge in Shank3+/+ (IL-1β one-way ANOVA followed by Sidak’s multiple comparisons test, F(2, 9) = 10.33, p = 0.005; TNF-α Kruskal−Wallis statistic 7.538, p = 0.012; Trpv4 one way ANOVA followed by Sidak’s multiple comparisons test, F(2, 9) = 2.768, p = 0.116). j mRNA expression analysis of IL-1β, TNF-α and Trpv4 genes after LPS challenge in Shank3+/− (IL-1β Kruskal−Wallis statistic 9.002, p = 0.002; TNF-α one way ANOVA followed by Sidak’s multiple comparisons test, F(2, 10) = 10.27, p = 0.004; Trpv4 one way ANOVA followed by Sidak’s multiple comparisons test: F (2, 9) = 31.26, p < 0.001). k Experimental design. Shank3+/− were crossed with Drd1a-tdTomato mice labeling specifically D1R-MSNs in a Shank3+/− background. Ex-vivo patch clamp recordings were made 24 h after the LPS injection. l Whole-cell recording of Trpv4 current 24 h after LPS challenge in Shank3+/+ and Shank3+/− mice (repeated measures ANOVA, voltage steps main effect F(1.171,25.77) = 12.11, p = 0.001, genotype main effect F(3, 22) = 0.4152, p = 0.744, genotype by voltage steps interaction F(120, 880) = 1.451, p = 0.002; n = 5 cells, 2 mice (Shank3+/+), n = 5 cells, 2 mice (Shank3+/+ + LPS), n = 7 cells, 2 mice (Shank3−/+) n = 9 cells, 2 mice (Shank3−/+ + LPS)). m Example traces from 300 pA depolarizing current injection in D1R + MSNs of Shank3+/− mice 24 h after: vehicle IP injection and treated with vehicle (left), LPS challenge and treated with vehicle (middle), LPS challenge and treated with HC-067047 (right). n Number of action potentials (nAPs) across increasing depolarizing current steps (0−500 pA) for D1R-tom+::Shank3+/− MSNs after LPS challenge (repeated measures ANOVA, treatment main effect F(2, 30) = 3.034, p = 0.063, current steps main effect F(10, 300) = 28.08, p < 0.001, treatment by current steps interaction F(20, 300) = 2.042, p = 0.006, n = 10 cells, 3−4 mice each group). Error bars report SEM.

