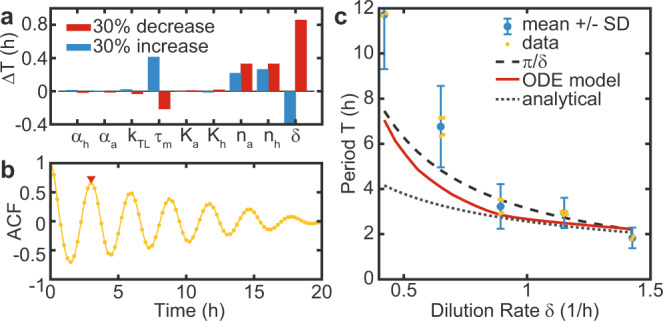
Fig. 3. The period of the free oscillator is determined by the dilution rate.

a A sensitivity analysis was performed by analyzing the change in the period ΔT in response to a 30% change in individual model parameters9. b Example of an auto-correlation function (ACF) that was used to estimate experimental periods for both reporters, corresponding to sample 4 in Fig. 2a. The red triangle indicates the first maximum. c Period as a function of the dilution rate T(δ). The experimentally measured periods are compared to predictions by our ODE model, an analytical solution by Hori et al.35, both with an mRNA lifetime of 32, and with the phenomenological T(δ) = Cπ/δ with C ≈ 1. While the predictions are in good agreement with the data at higher dilution rates, the measured periods are systematically higher at lower dilution rates. Data shows means ± SD of N = 2, or N = 4 technical replicates, as indicated by individual data points (jittered). As time traces with periods > 6 h only contain 2-3 maxima, we additionally accounted for a systematic measurement uncertainty that scales inversely with the number of maxima. System parameters are as in Fig. 2, with α = 3 pMs−1.
