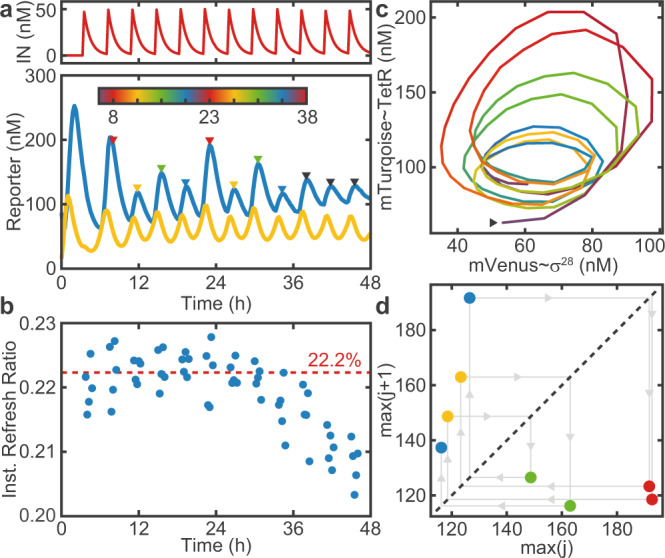
Fig. 5. Period doubling.

a Time traces of a 4-cycle (λ = 1.20). b The instantaneous refresh ratio drops after 36 h due to fatigue. The dashed line indicates the average Rt over the first 24 h. c Phase space trajectory. Color indicates time and is scaled to span 4 ⋅ Tin, as indicated by the colorbar in a. The arrow marks the starting point of the trajectory, which follows a counter-clockwise path. d Maximum return map for the maxima indicated in a. After the last point, the system transitions to a 1-cycle.
