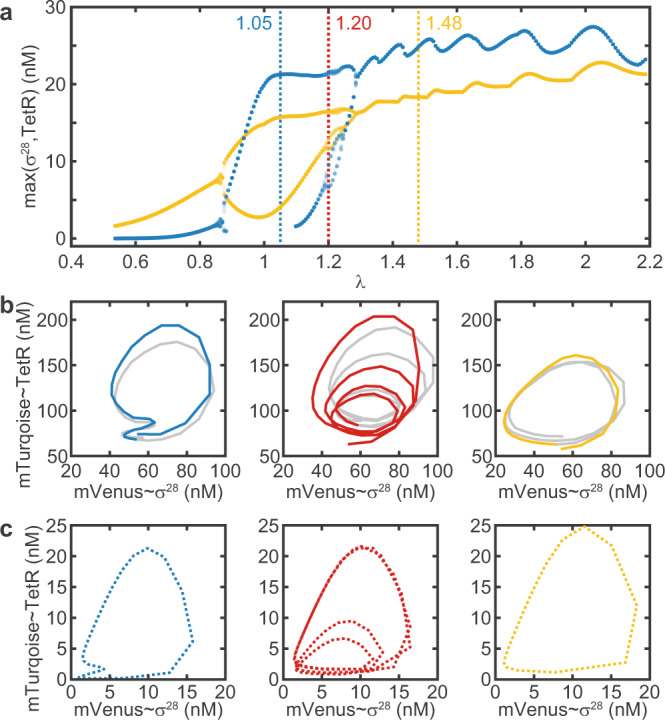
Fig. 6. Bifurcation analysis for varying λ.

a Simulated bifurcation diagram showing the maxima for σ28 (yellow) and TetR (blue). The values of λ that correspond to the experimental data in b and simulations in c are indicated by dashed vertical lines. b Experimental phase portraits exhibit a 2-, 4-, and 1-cycle. A second (third) m-cycle is grayed out for clarity. The 2-cycle is degenerate in the TetR-axis, i.e., the second maximum does not show in the time traces. Data for the 1-cycle and 4-cycle is the same as shown in Figs. 4b and 5. c Simulated phase portraits. Simulations only show endogenous TetR generated by the reaction, rather than total TetR, to match the experimentally observed fluorescence signals. Parameter values are as in Fig. 2, except α = 5 pMs−1, n = 4, Tin = 4 h, Ain = 50 nM.
