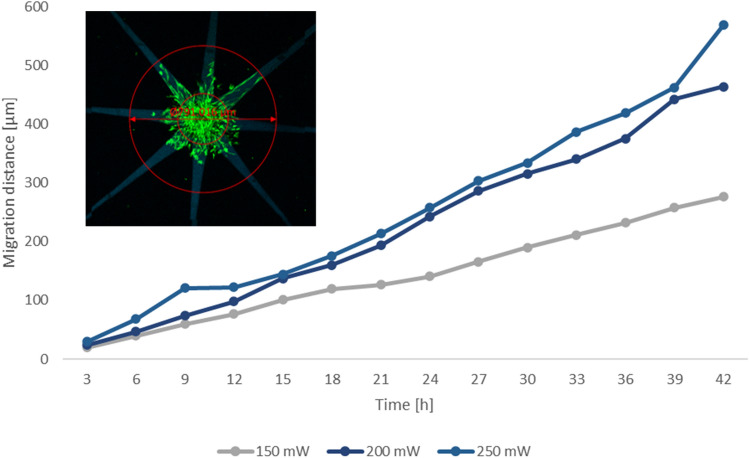
Figure 4.
Quantification of hASCs migration: The migration distance of GFP-hASCs into the patterns, photografted at different power settings, is plotted over the time and calculated as a mean value from five samples in total and at least three different data sets per time point. A linear mixed effects model was used to interpret the data, due to the large deviation between samples. The image in the upper left quarter depicts how the migration distance was measured.

