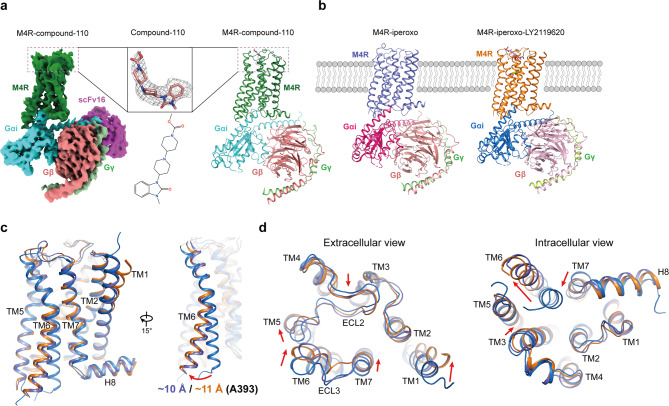
Fig. 1. Cryo-EM structures of the M4R complexes.
a Cryo-EM map of M4R–Gi–scFv16 in complex with compound-110 (left) and cartoon representation of the M4R–c110–Gi complex structure (right). The cryo-EM density of compound-110 (salmon) and the two-dimensional representation of the compound-110 chemical structure is shown. b The cryo-EM structures of M4R–ip–Gi complex (left) and M4R–ip–LY–Gi (right) complex are shown in cartoon representation. Iperoxo and LY2119620 are shown as yellow ball-sticks and magenta sticks, respectively. c The outward movement of TM6 in M4R–ip–Gi and M4R–ip–LY–Gi structures compared with that in inactive M4R structure (PDB code 5DSG), with residue A393 as reference. d Extracellular and intracellular views of inactive and active M4R structures. Conformational changes from inactive to active state are indicated with red arrows.

