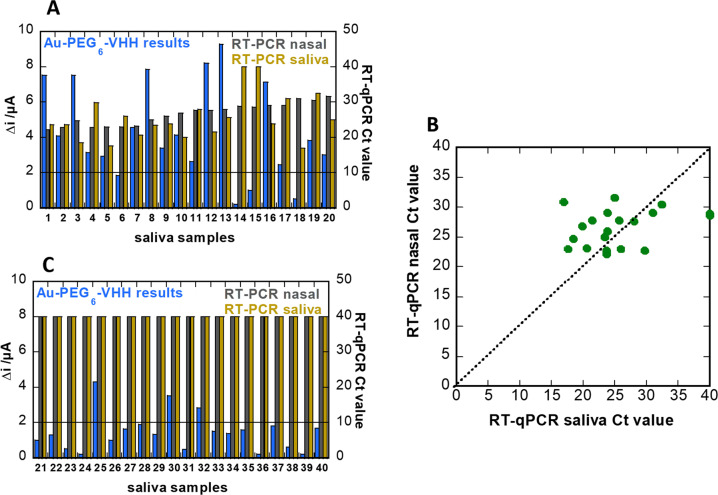
Fig. 8. Performance of sensor in saliva clinical samples.
A Response diagram for saliva samples from COVID-19 positive patients (n = 20) as recorded on Au-PEG6-VHH electrodes (blue). Cycle threshold value of RT-qPCR on nasal swab samples of same patient (grey), as well as RT-PCR of saliva (brown). The current cut-off value for positive samples was 2 µA. B Collection of RT-qPCR values of nasopharyngeal swab samples vs. saliva samples collected from the same patient and measured in the hour after sample taking. C Response diagram for saliva samples from COVID-19 negative patients (n = 20) as recorded on Au-PEG6-VHH electrodes (blue) and Cycle threshold value of RT-PCR on nasal swab samples (grey), and saliva (brown).

