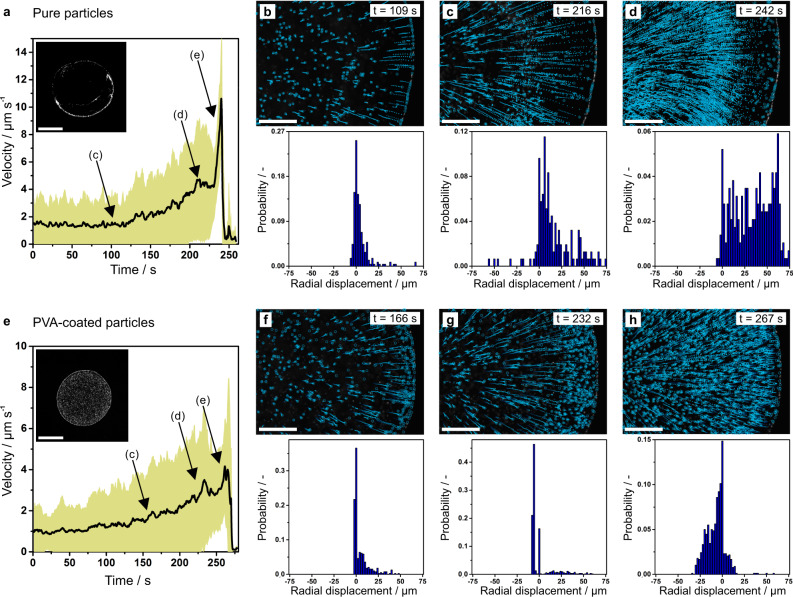
Fig. 4. Hydrodynamic flow behavior of drying dispersions.
Hydrodynamic flow of drying of dispersions containing pure (a–d) and PVA-modified fluorescent PS particles (e–h) measured by fluorescence microscopy with the focal plane set 4 µm above the substrate. a, e Average particle velocity measured over the duration of drying, with the standard deviation shown in light green. Inset: Fluorescent microscopy image of the dried deposit. Scale bar: 1 mm. b–d, f–h Particle flow revealed by fluorescent tracer particles for pure (b–d) and PVA-modified particles (f–h). Top: Snapshots of the particle trajectory. The open circle corresponds to the position of the tracked particle and the dotted line shows the trajectory of the particles over the last 25 s. Scale bar: 200 µm. Bottom: Normalized histogram of the radial particle displacement over 5 s. Negative values correspond to an inward flow and positive values to an outward flow.

