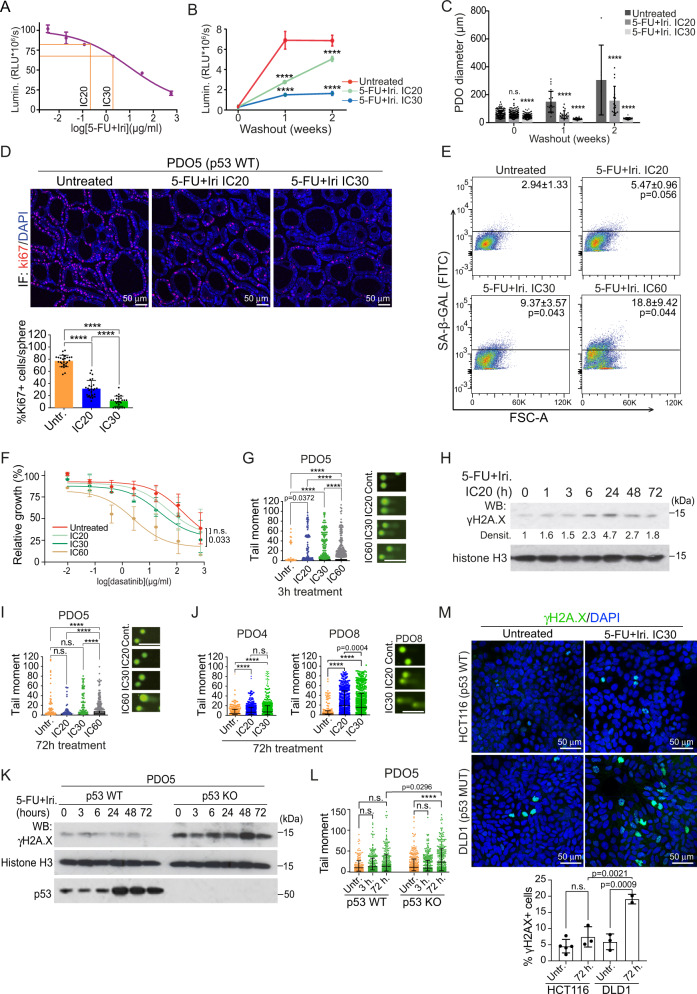
Fig. 1. Low-dose CT treatment induces a non-senescent quiescent-like state to CRC PDO in the absence of persistent DNA damage.
A Dose-response assay of PDO5 treated with 5-FU + Iri. for 72 h, indicating the IC20 and IC30 doses (n = 3 replicates examined, from one out of four biologically independent experiments). B, C Quantification of PDO5 B viability (n = 3 replicates examined, from 1 out of 4 biologically independent experiments) and C diameter (n = at least 15 spheres examined whenever possible over four biologically independent experiments), after 72 h of 5-FU + Iri. treatment and 1–2 weeks of washout. D Representative ki67 stainings of PDO5 treated for 72 h as indicated, and quantification of ki67+ cells/sphere (n = 25 spheres examined over 3 biologically independent experiments). E Flow cytometry analysis of SA-β-Gal activity in PDO5 treated as in D. F Dose–response curves of PDO5 treated with dasatinib for 3 days after 5-FU + Iri. pre-treatment, as indicated (n = 2–3 biologically independent experiments). G Comet assay in PDO5 treated for 3 h as indicated (n = more than 700 cells examined over three independent experiments). H WB analysis of the DNA damage sensor γH2A.X in PDO5 cells collected at the indicated time points after 5-FU + Iri treatment (from one out of three biologically independent experiments). I, J Comet assay in 53 WT PDO5 I and p53 mutants PDO4 and PDO8 J, treated for 72 h as indicated (n = >800 cells examined over 3 independent experiments). K, L WB analysis K (from one out of three biologically independent experiments) and comet assay L of PDO5 CT and TP53 KO untreated or treated with 5-FU + Iri. at the same concentration at the indicated time points (n = more than 490 cells examined over 3 independent experiments). M Representative γH2A.X staining and quantification of HCT116 and DLD1 cell lines treated for 72 h with 5-FU + Iri. at the same concentration (5-FU 0.1 µg/mL and Iri. 0.04 µg/mL) (n = more than 50 cells examined over 2-3 biologically independent experiments). For all applicable figure panels, data are mean ± SD, except for G, I, J, and L (Tukey method for box plots), where boxes represent the central 50% of the data (from the lower 25th percentile to the upper 75th percentile), lines inside boxes represent the median (50th percentile), and whiskers are extended to the largest value less than the sum of the 75th percentile plus 1.5 IQR (the difference between the 25th and 75th percentile) or greater than the 25th percentile minus 1.5 IQR, and plot any values that are greater or lower than this as individual points. Significance (p) was calculated with one-way ANOVA test, except for B and C (two-way ANOVA) and F (two-sided logistic regression trend test). For G, I, and J scale bar represents 50 μm. ****p < 0.0001; n.s., no significant. 5-FU, 5-fluorouracil; Iri, irinotecan; SA-β-Gal, SA-β-Galactosidase; IC20, IC30, and IC60 indicate 5-FU + Iri. treatment leading to 20, 30, and 60% cell death, respectively. Source data are provided as a Source Data file.

