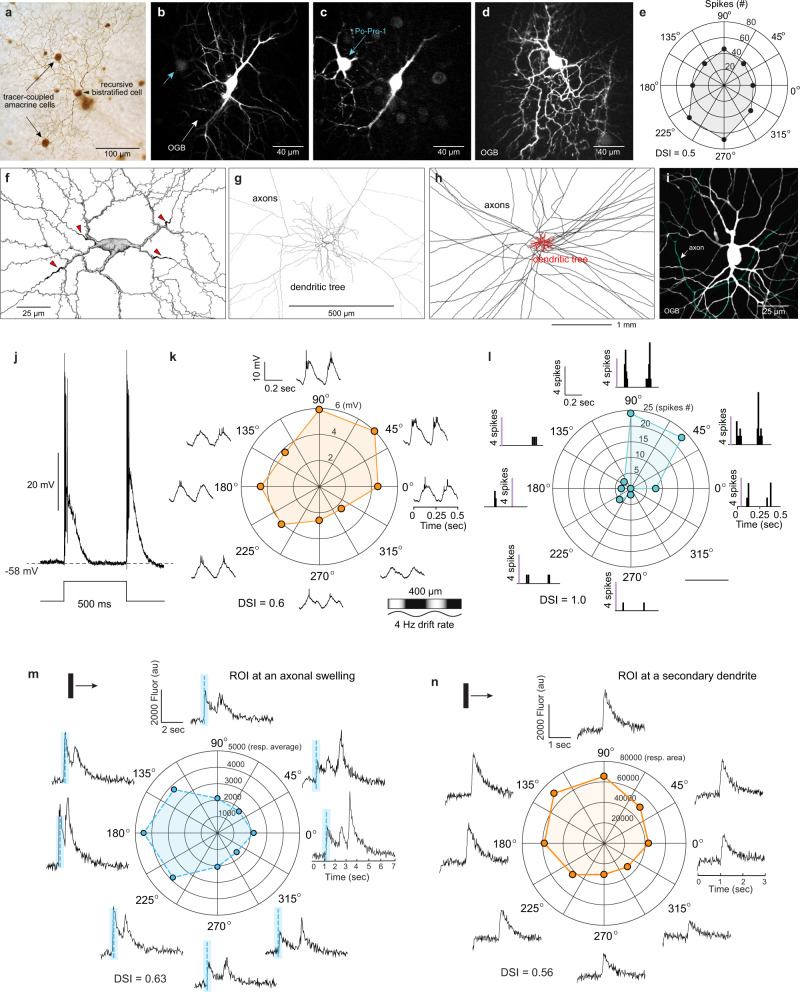
Fig. 4. The recursive bistratified ON–OFF direction-selective ganglion cell is tracer coupled to the A1 amacrine cell, a polyaxonal, ON–OFF spiking cell type that also shows direction selectivity.
a A recursive bistratified ganglion cell (arrowhead; Neurobiotin fill) shows tracer coupling to the A1 amacrine-cell (arrows). b A1 amacrine cell (dye fill with OGB and Po-Pro-1) showing excitation of the OGB (488 nm). c Po-Pro-1 excitation (420 nm) a tracer-coupled ganglion cell is evident in the same field (blue-arrow). d OGB filling of a ganglion cell tracer coupled to another A1 amacrine corresponds to the recursive bistratified type. e Direction-selective response (intracellularly recorded spikes, DSI = 0.5) of cell shown in (d). f Drawing of an A1 amacrine cell shows the origin of four axon-like processes from proximal dendrites (red arrowheads). g The axon-like processes extend widely beyond the dendritic tree. h At lower magnification the full extent of the axon-like arbor (black) relative to the dendritic tree (red) is shown (Neurobiotin fills; f, g drawings modified from previously published anatomical descriptions of the A1 cell47,48). i OGB fill of an A1 cell in vitro illustrates how the axonal component (pseudo-colored blue–green) is distinguished from the main dendrites for functional calcium imaging. j The A1 cell responds transiently at light ONset and OFFset with large, ~60 mV spikes. Direction-selective changes in membrane voltage (peak to peak amplitude, mV) (k) and spike count (l) in the same cell in response to a sinusoidal drifting grating (4 Hz drift rate, 200 µm cycle period; 100% contrast). Peak to peak amplitude (mean DSI ± s.d. = 0.7 ± 0.21; n = 5) and total spike count (mean DSI ± s.d. = 0.47 ± 0.34; n = 12). Direction-selective calcium responses evoked by moving bar stimuli from A1 axon (m) and dendrite (n). For m (axonal swelling), the stimulus was a bright bar (500w × 1000 h; velocity 1000 µm/s; contrast 100%, (DSI = 0.63); 0.47 ± 0.10 (range = 0.28– 0.63), n = 11 axon ROIs). For n (dendrite), the stimulus was a faster moving, lower contrast bar (100w × 700 h, velocity 8000 µm/s contrast 60%, (DSI = 0.56); 0.41 ± 0.15, (range = 0.22–0.63, n = 9 dendrite ROIs).

