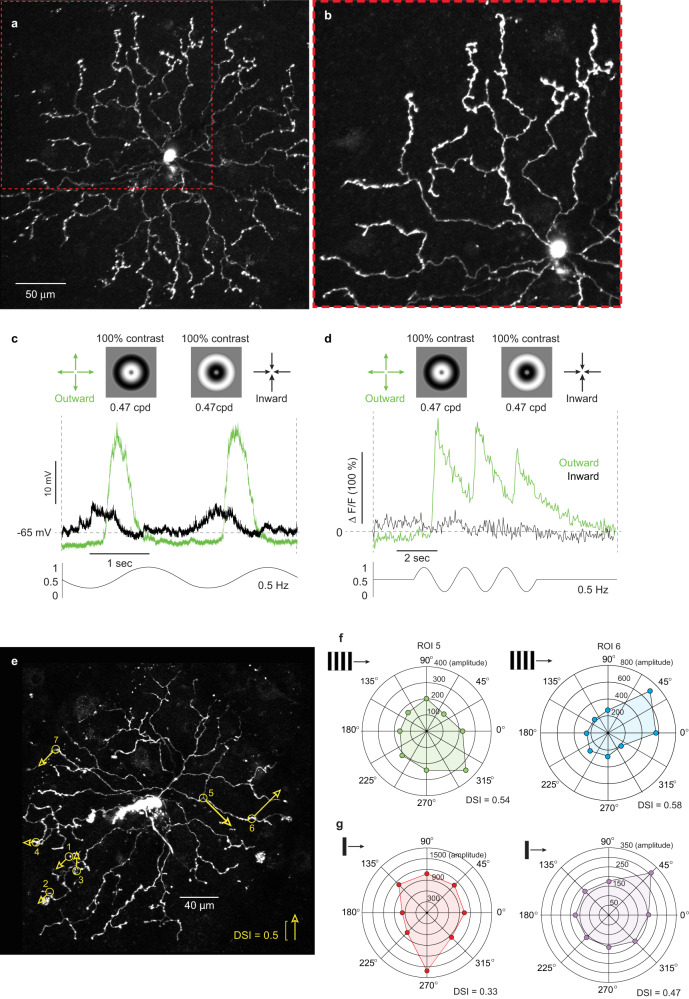
Fig. 6. Morphological identification and direction selectivity of macaque starburst amacrine cells.
a Starburst amacrine cell targeted for patch-clamp recording in the in vitro retina and filled with the calcium indicator Oregon Green Bapta-488 (OGB). The thin primary and secondary dendrites and distinct varicose dendritic terminals create a radially symmetric, nearly circular dendritic tree, a feature common to starburst cells of other non-primate mammals (max intensity z-projection from 2P-confocal image stack). b Magnified view of boxed area (red dotted line) illustrates the characteristic extremely thin primary and secondary dendrites and the thicker, complex varicose terminal dendrites. c Somatic intracellular voltage recording of another starburst cell shows selectivity to radial outward motion using an expanding (green trace) or contracting (black trace) radial-grating stimulus; 2 stimulus cycles shown (100% contrast; 0.24 cycles/degree of visual angle; 0.5 Hz temporal frequency; n = 6; inward/outward = 0.26 ± 0.17). d Calcium response, 2 P optically imaged ROIs at the terminal dendrites of another starburst cell also show selectivity to radial outward motion; 3 stimulus cycles shown (n = 36 ROIs; inward/outward = 0.32 ± 0.18). Macaque starburst cell dendrites also showed direction selectivity to both moving bars and drifting square wave gratings. e Max intensity z-projection of OGB-488 filled starburst in vitro; locations of 7 dendritic ROIs are indicated by the yellow circles; arrows indicate preferred direction and arrow length indicates direction-selective strength (peak amplitude, mean of 3 stimulus cycles to drifting square-wave gratings (0.47 cycles/deg, 0.5 Hz) at 8 orientations; n = 7 ROIs; 0.29 ± 0.20; range = 0.15–0.58 DSI). f Polar plots of the optically imaged calcium response of 2 ROIs (5 and 6) from the cell shown in (e). g Examples of two additional polar plots for dendritic ROIs for two additional cells using drifting bars (bar w x h = 200 × 700 µm, 4000 µm/s) to measure directional tuning (n = 12 ROIs from 7 cells; mean ± s.d. = 0.37 ± 0.17, range = 0.12–0.76 DSI).

