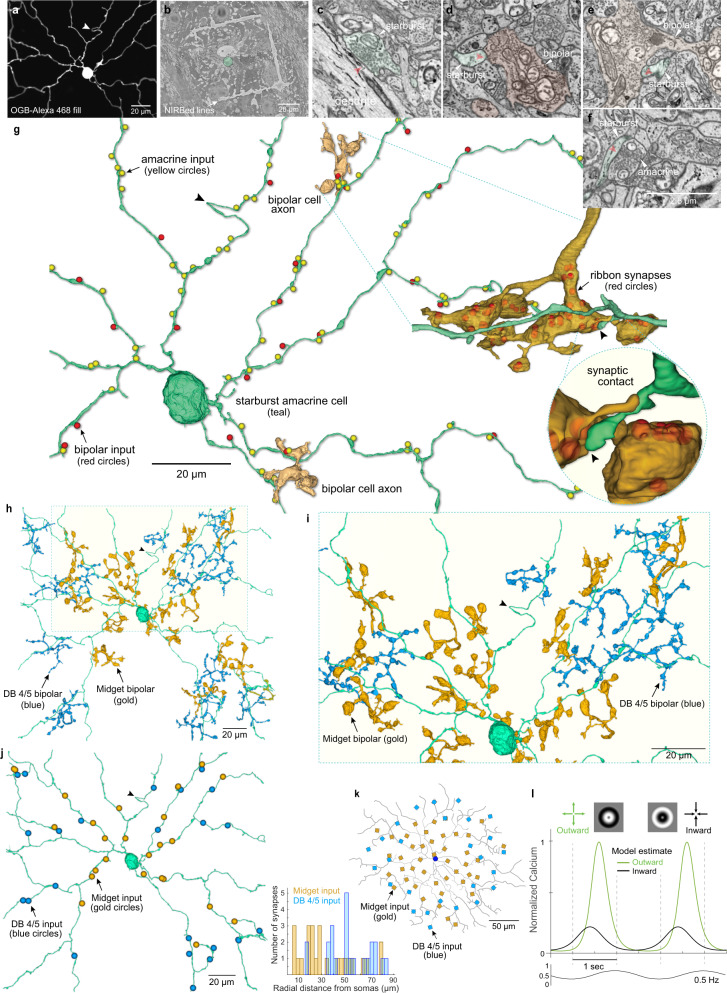
Fig. 9. Connectomic reconstruction reveals spatial layout of distinct bipolar-cell types for an identified macaque starburst amacrine cell.
a Dendritic morphology of a physiologically identified starburst cell (OGB + Alexa 468 fill; arrowhead indicates hairpin loop in a dendrite (see also g). b NIRBing (see Methods) was used to burn fiducial marks in the optic fiber layer around the starburst cell (teal dot). c Starburst synaptic output from peripheral dendrite (teal fill; red arrowhead) to ganglion cell dendrite. d, e Bipolar cell (tan fill) ribbon synaptic input to short spines (teal fill, red arrowhead) arising from main dendrites. f, Inhibitory synaptic input to a proximal starburst dendrite (teal fill; red arrowhead; scale applies to c–e). g Inhibitory synaptic inputs (yellow balls) and bipolar-cell ribbon excitatory synaptic inputs (red balls) to a portion of the starburst dendritic tree (arrowhead indicates dendritic hairpin shown in a). The axon terminals of two presynaptic bipolar cells are shown (gold fills); one of these terminals is enlarged and rotated (dotted lines) with ribbon synapses indicated by red balls within the axon terminal. Inset shows how a starburst spine receives a single ribbon synapse from this axon terminal. h Two distinct bipolar-cell types synapse with the starburst tree; smaller axon terminals (gold) are midget bipolar cells and larger blue terminals are identified as diffuse bipolar type 4/5 (DB4/5) (see Fig. 10). i Zoomed view of all bipolar synaptic contacts on a portion (light yellow boxed area in h) of the dendritic tree. j Left, locations of all midgets (gold balls) and DB4/5 synapses (blue balls) on the starburst tree. Histogram plots distance of bipolar-cell axon terminal from the starburst cell body (midget bipolar, n = 25, mean ± s.d. distance from starburst soma = 34.5 ± 23.6 µm, DB4/5, n = 23, mean ± s.d. distance from starburst soma = 54.3 ± 19.6 µm; these mean spatial distributions differ significantly, unpaired t-test: t(46) = −3.1433, *p = 0.0029, Cohen’s d = 0.91). k Distribution of bipolar inputs based on anatomical data (gold – midget bipolars; blue – DB4/5 bipolars) used in a starburst cell model (see “Methods”) in which the cell received only excitatory input from simulated bipolar cells (5–15 pS/synapse; n = 70). l Distal dendritic calcium responses in the model showing robust directional difference to radial motion (see “Methods”).

