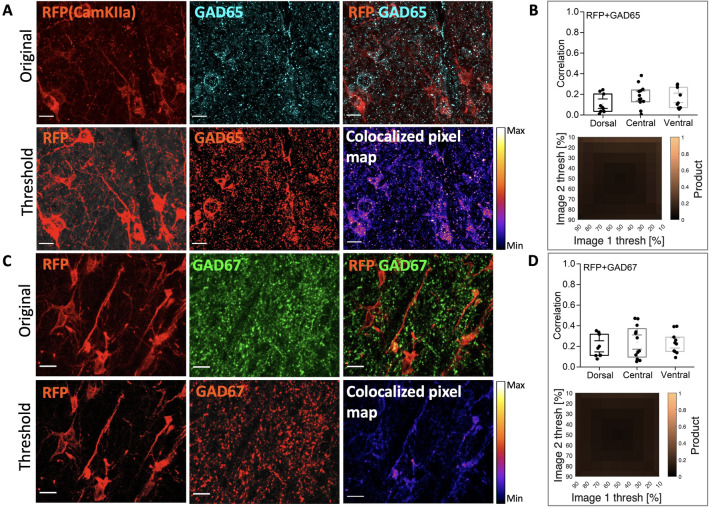
Figure 6.
AAV9-CamKIIa-infected cells has poor overlap with GAD65 and GAD67 biomarkers. (A) Top row: mScarlet expression (red, RFP) and the immunostaining of GAD65 (cyan) has only little co-expression, and second row: threshold representations of the original images and a heat map co-expression plot of RFP/GAD65. (B) Top right grey box: plots show poor correlation in pixel-overlap between RFP and GAD65. (C) First row: original images of RFP, GAD67 (green) and their overlap, and bottom row: threshold representations of the original images and the heat map of RFP/GAD67. (D) Bottom right grey box: the mosaic of correlation coefficients for various thresholds, indicate poor overlap between RFP and GAD67. (N = 3 rats, n = 3-4 sections/rat). Scale bar 20 m.

