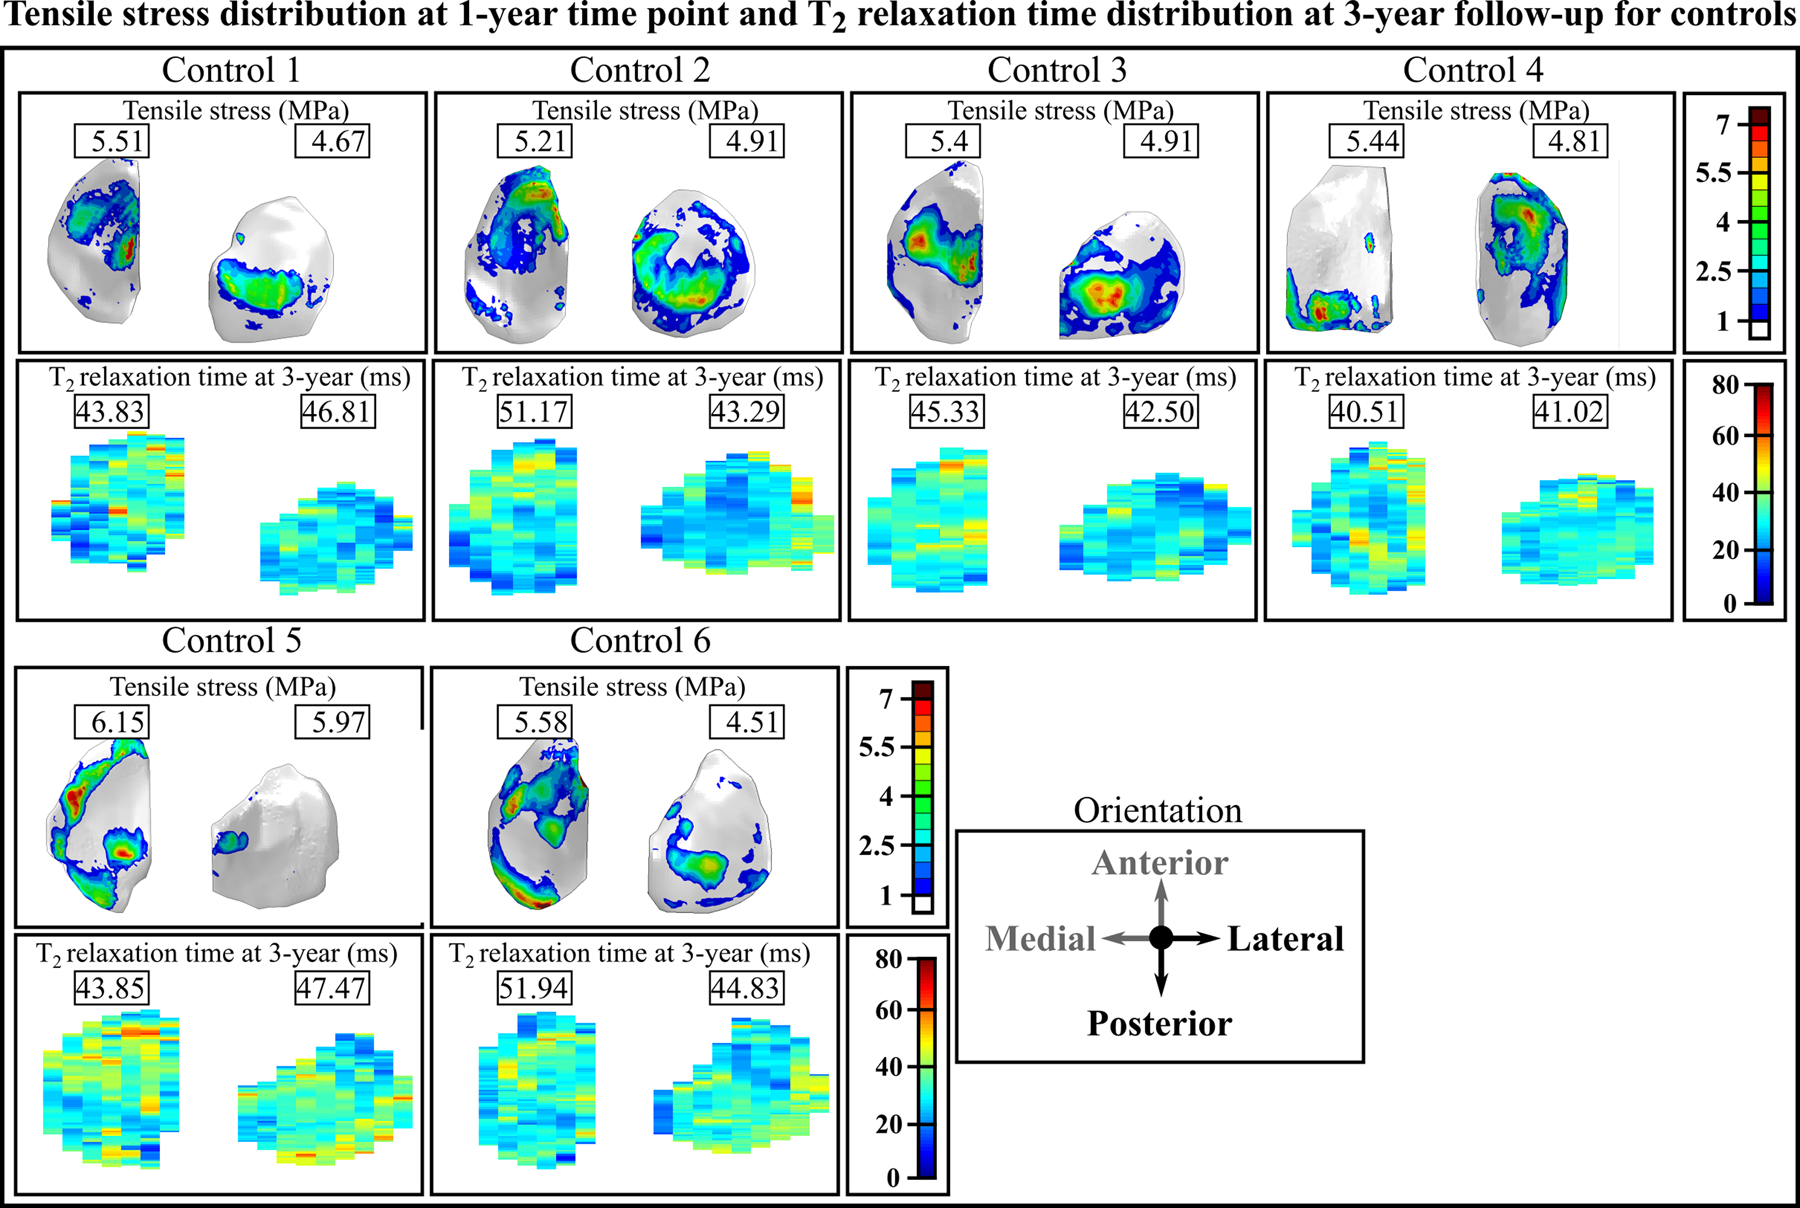
Figure 3.

Axial view of the maximum principal (tensile) stress distribution at the 1-year follow-up time point and the T2 relaxation time distribution at the 3-year follow-up time point in healthy controls. Peak values for tensile stresses are given for each compartment. The values for the T2 relaxation time are given for the same location as peak tensile stresses. Note: The T2 relaxation time distribution at the 1-year follow-up time point is not presented, since it is almost identical with the 3-year follow-up time point. Note: Both left and right knees are shown in the same coordinate system, with medial compartment on the left.
