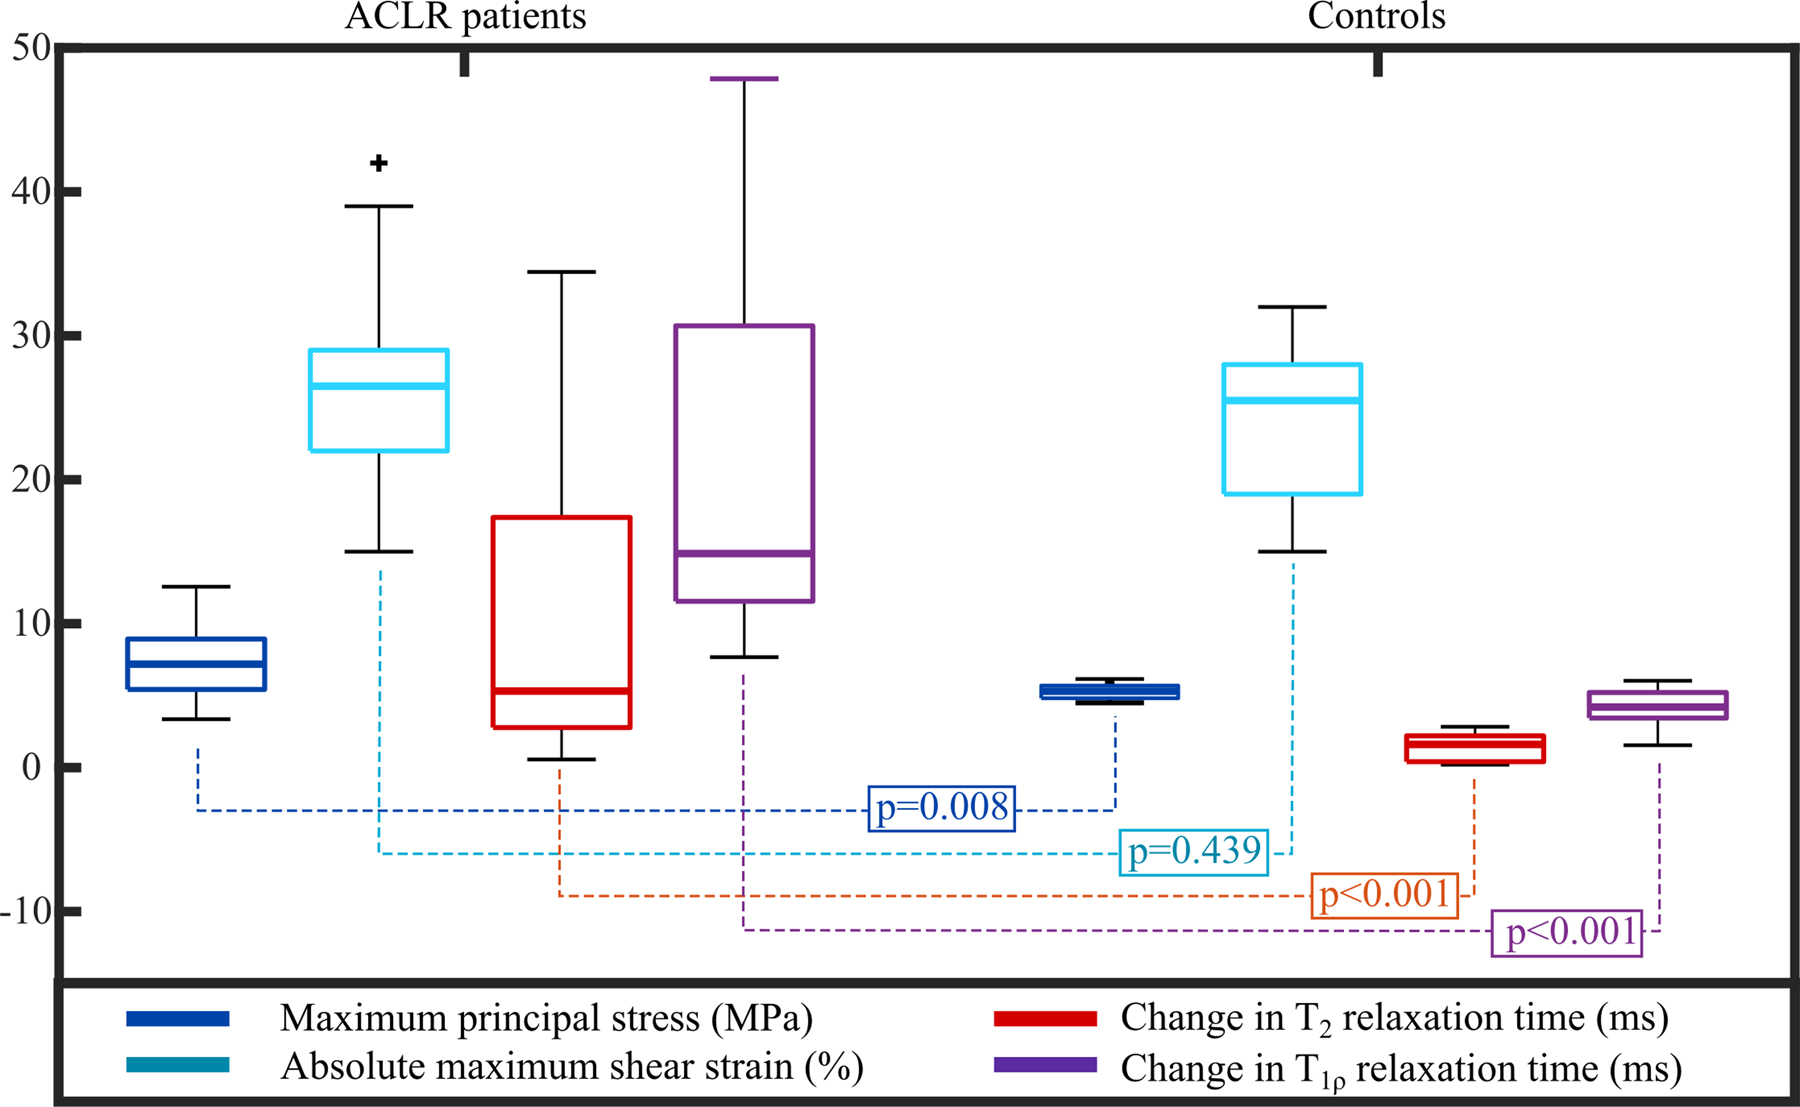
Figure 6.

Box plots of the peak values of maximum principal (tensile) stresses and absolute maximum shear strains during the stance phase of gait at the 1-year time point and changes in the T2 and T1ρ relaxation times between the 1- and 3-year follow-up time points for patients with ACLR and healthy controls. Mann-Whitney U-test p-values are also provided.
