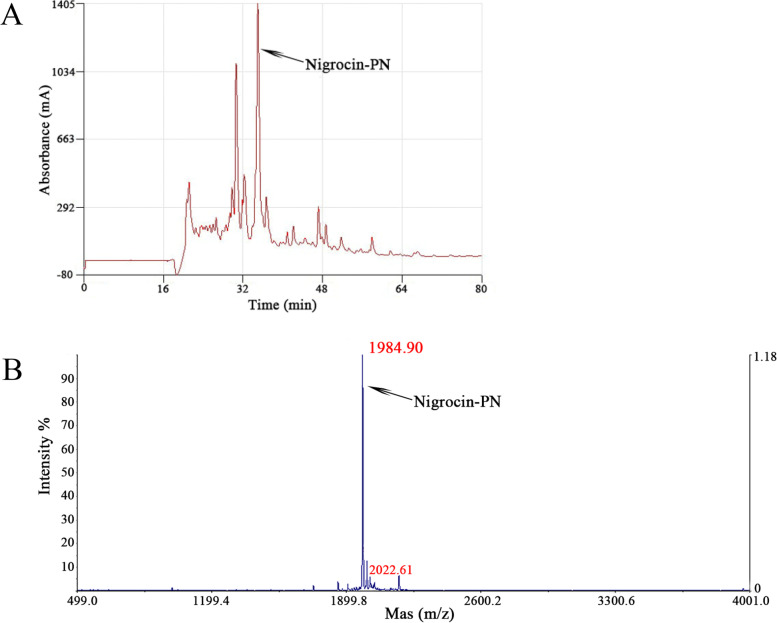
Fig. 2.
Purification of Nigrocin-PN. A is the RP-HPLC chromatogram of the crude synthetic peptide. The highest absorbance peak indicated by an arrow shows the position of the targeted peptide, x-axis shows the retention time, while the y-axis displays the relative absorbance. B is the MALDI-TOF mass spectrum of Nigrocin-PN, the x-axis is mass to charge ratio (m/z), and y-axis is the intensity of the substance. m/z 1984.91 indicated the singular protonated molecular mass, while m/z 2022.61 is identified as Nigrocin-PN with potassium adduct ion; no distinct peak at m/z 3986 reveals a high ratio of inner-molecular disulphide bond was formed

