Fig. 4.
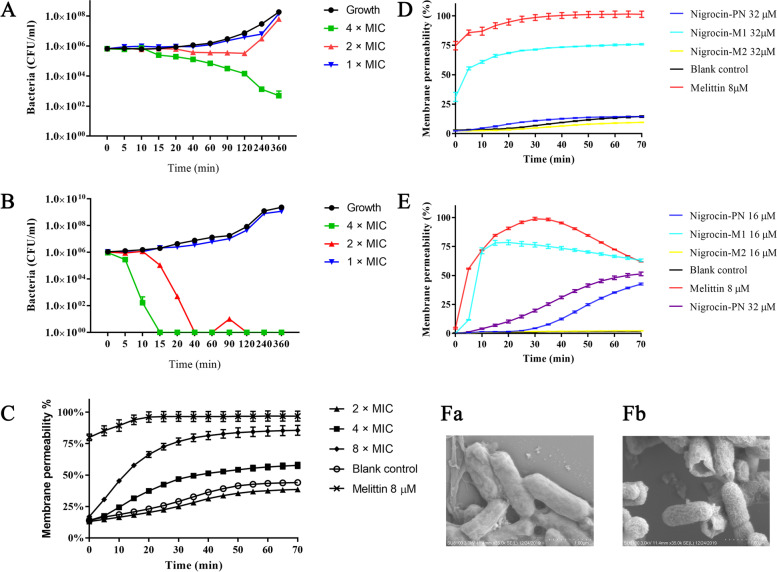
Time-killing curves for Nigrocin-PN on S. aureus (A) and E. coli (B); the concentration of Nigrocin-PN added was fourfold, twofold, and onefold of its MIC. Dynamic membrane permeability curves of Nigrocin-PN at different concentrations towards S. aureus (C). Permeability curves of Nigrocin-PN, Nigrocin-M1, and Nigrocin-M2 on MRSA (NCTC 12,493) (D) and on E. coli (E), the determined concentrations for Nigrocin-PN and Nigrocin-M1 were performed at twofold of their MICs, Nigrocin-M2 kept the same concentration in each group for better comparison, and 8 µM melittin in PBS was used as a positive control. The error bar represents the standard error for three repeats. Fa and Fb were K. pneumoniae (ATCC 13,883) treated with 0 and 16 µM Nigrocin-PN under 24 h of incubation, respectively

