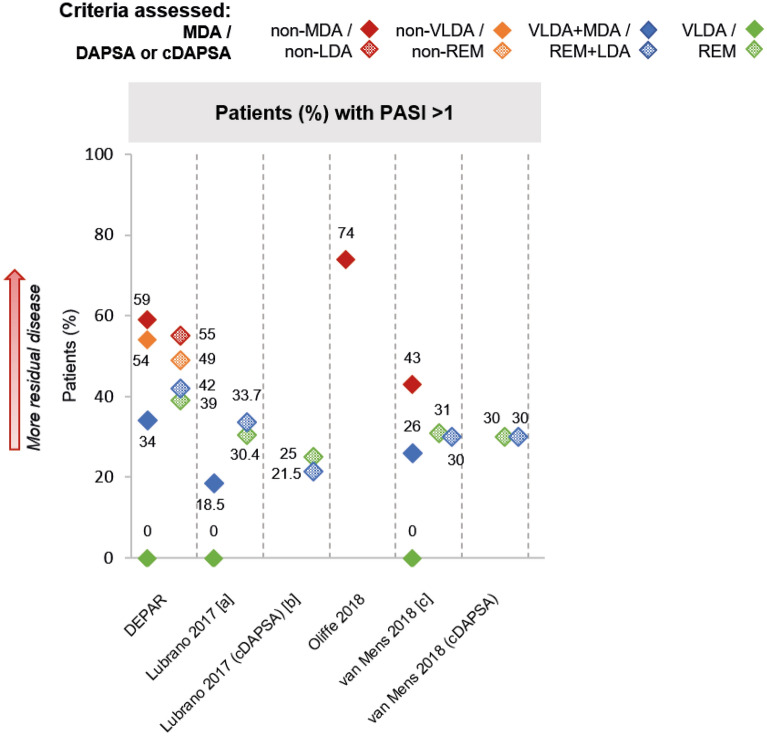
Fig. 3.
Prevalence of skin disease by PASI, where reported. Note: Unless stated otherwise, shapes with hatching refer to patients assessed by DAPSA, not cDAPSA. Asterisk indicates that data were inversed for ease of comparison (e.g. percentage of patients with PASI ≤ 1 has been transformed into percentage of patients with PASI > 1). [a] VLDA group: in a separate subgroup analysis of n = 15, 12 (80.0%) patients had PASI 0–0.3, 2 (13.3%) patients had PASI 0.4–0.6 and 1 (6.7%) patient had PASI 0.7–1; DAPSA REM group: in a separate subgroup analysis of n = 18, 11 (61.1%) patients had PASI 0–0.3, 2 (11.1%) patients had PASI 0.4–0.6 and 5 (27.7%) patients had PASI > 1. [b] cDAPSA REM: in a separate subgroup analysis of n = 22, 14 (63.6%) patients had PASI 0–0.3, 2 (9.0%) patients had PASI 0.4–0.6, 1 (4.5%) patient had PASI 0.7–1 and 5 (22.7%) patients had PASI > 1. [c] p = 0.002 VLDA + MDA vs. non-MDA. PASI Psoriasis Area and Severity Index

