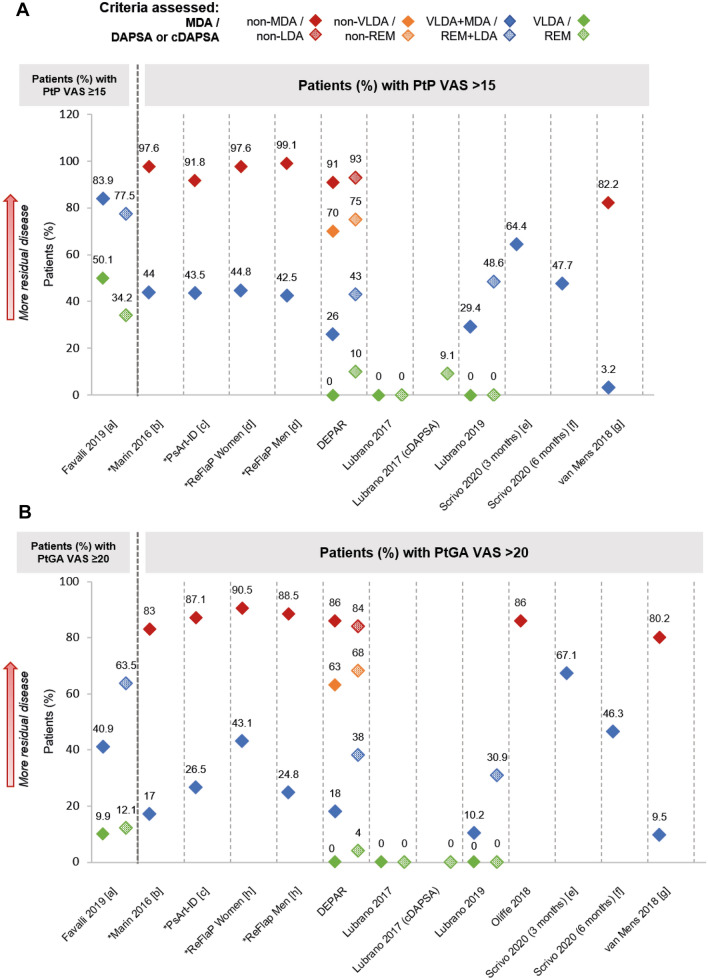
Fig. 4.
Patient pain VAS (a) and patient global assessment VAS (b), where reported. Note: Unless stated otherwise, shapes with hatching refer to patients assessed by DAPSA, not cDAPSA. Asterisk indicates data that were inversed for ease of comparison (e.g. percentage of patients with PtP VAS ≤ 15 has been transformed into percentage of patients with PtP VAS > 15). [a] Digitised from a graph in the abstract. [b] p < 0.0001 VLDA + MDA vs. non-MDA. [c] p < 0.001 VLDA + MDA vs. non-MDA. [d] p = 0.771 VLDA + MDA women vs. men; p = 0.355 non-MDA women vs. men. [e] Data unknown for 11 (7.4%) participants. [f] Data unknown for 24 (16.1%) participants. [g] Digitised from a graph in the manuscript; p < 0.001 VLDA + MDA vs. non-MDA. [h] p = 0.011 VLDA + MDA women vs. men; p = 0.594 non-MDA women vs. men. PtGA patient global assessment, PtP patient pain, VAS visual analogue scale

