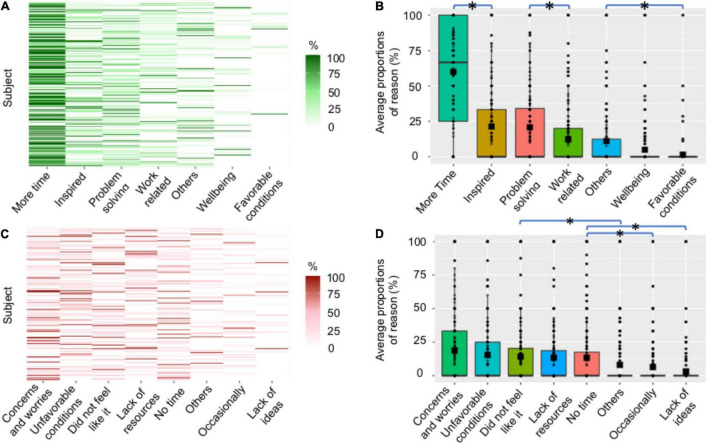
FIGURE 4.
Reported reasons for positive and negative changes in creative activities. (A) Proportions of reasons for positive changes. Each row represents a participant, and reasons are sorted by decreasing average proportion across subjects. (B) Boxplots of the average proportion of reasons for positive changes across subjects. Each dot represents a participant, color boxes represent the upper and lower quartiles, and squares indicate the mean. Stars indicate significant differences between proportions of selected reasons (post-hoc tests with pcorr < 0.05). (C,D) Are the equivalent of (A,B), respectively, for negative changes.

