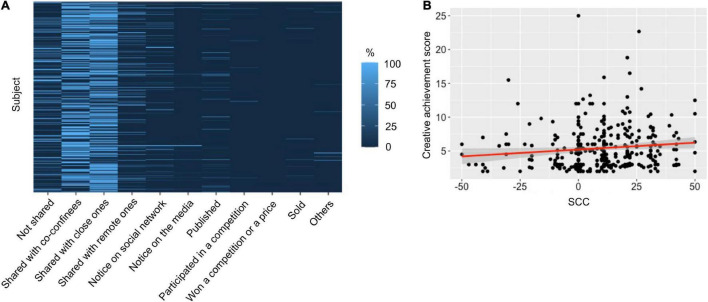
FIGURE 5.
Creative achievements. (A) Proportion of the selected levels of creative achievement averaged across activities for each subject. (B) Individual SCC as a function of individual creative achievement score. The red line indicates a significant correlation between SCC and the creative achievement score (Spearman correlation, p < 0.05).

