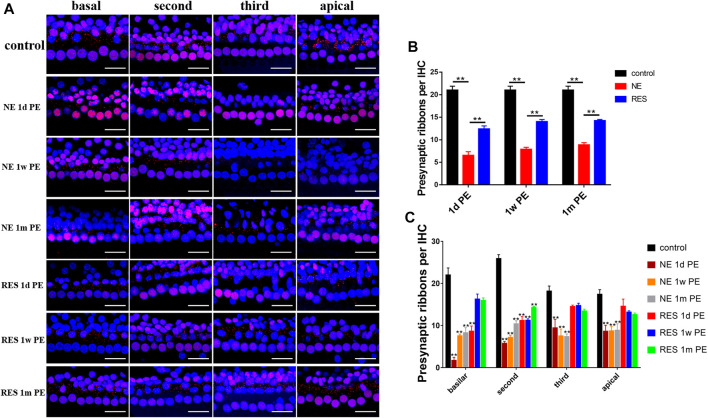
FIGURE 2.
Noise induced changes in ribbon density (ribbons per IHC), the values are presented as the means ± SEM. (A) Representative images showing ribbon changes by the noise exposure. Scale bar = 100pixel. (B) The ribbon density at different time after noise. n = 24 locations in each group. (C) Ribbon changes of different turn by the noise exposure. n = 6 in each group. Note: In (B), *p < 0.05, **p < 0.01, as compared with NE group. In (C), *p < 0.05, **p < 0.01, as compared with control group.

