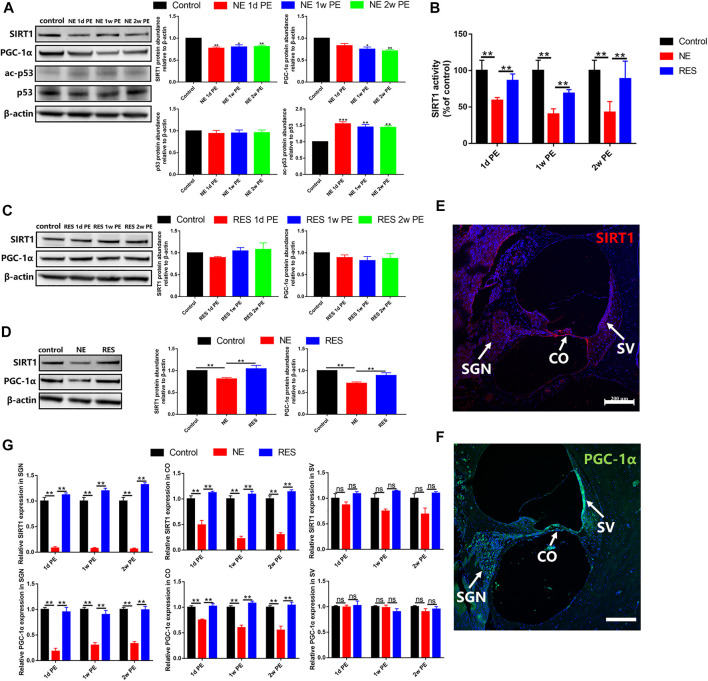
FIGURE 4.
SIRT1, p53 and PGC-1α after noise exposure, the values are presented as the means ± SEM. (A) The protein levels of SIRT1 (130 kDa), PGC-1α (110 kDa), p53 (53 kDa) and acetylation of p53 after noise exposure in the NE group. (B) SIRT1 activity was measured based on an enzymatic reaction using a SIRT1 assay kit. (C) The protein levels of SIRT1 (130 kDa), PGC-1α (110 kDa) after noise exposure in the RES group. (D) The comparison among the control group, NE group and RES group at the aspect of the protein levels of SIRT1 (130 kDa), PGC-1α (110 kDa). (E) The expression of SIRT1 in the cochleae of guinea pigs in the control group. Scale bar = 200 µm. SV: stria vascularis, CO: Corti’s organ, SGN: spiral ganglion neuron. Red is used to mark the expression of SIRT1, and blue is used to mark the nucleus. (F) The expression of PGC-1α in the cochleae of guinea pigs in the control group. Scale bar = 200 µm. SV: stria vascularis, CO: Corti’s organ, SGN: spiral ganglion neuron. Green is used to mark the expression of PGC-1α, and blue is used to mark the nucleus. (G) The comparison among the control group, NE group and RES group at the aspect of the expression of SIRT1 and PGC-1α in cochlea by immunolabeling. SV: stria vascularis, CO: Corti’s organ, SGN: spiral ganglion neuron. Note: In (A)–(D), n = 3 from 3 animals in each group, both cochleae of the same guinea pig as a sample. In (G), n = 6 from 3 animals in each group. In (A), *p < 0.05, **p < 0.01, ***p < 0.001, as compared with control group.

