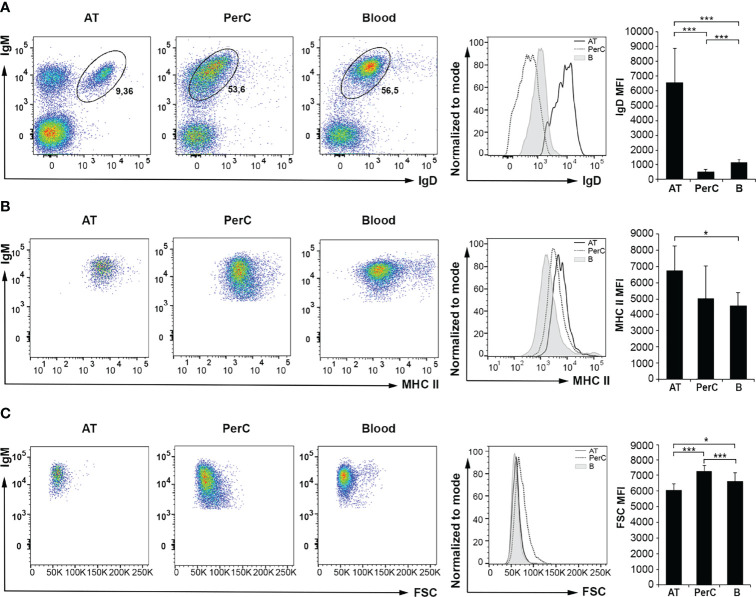
Figure 2.
Flow cytometry analysis of IgD and MHC II surface expression levels and cell size of IgM+IgD+ B cells in rainbow trout AT compared to peritoneal cavity (PerC) and blood IgM+IgD+ B cells. Leukocytes isolated from AT, PerC and blood were labeled with mAbs against trout IgM, IgD and MHC II and analyzed by flow cytometry. (A) Representative dot plots with IgM and IgD (A) or MHC II (B) fluorescence intensities from each tissue are shown, along with an histogram with IgD (A) or MHC II (B) surface expression levels on IgM+IgD+ B cells from tissues of one representative fish, and the corresponding graph showing the mean fluorescence intensity (MFI) values (mean + SD; n = 8 fish). (C) Representative dot plots showing IgM and FSC values of IgM+IgD+ B cells in each tissue are shown, along with an histogram with FSC values of IgM+IgD+ B cells from one representative fish, and the corresponding graph showing FSC MFI values (mean + SD; n = 8 fish). AT, Adipose tissue; PerC, Peritoneal cavity; B, Blood. Asterisks denote significantly different values between indicated groups (*p ≤ 0.05 and ***p ≤ 0.005).

