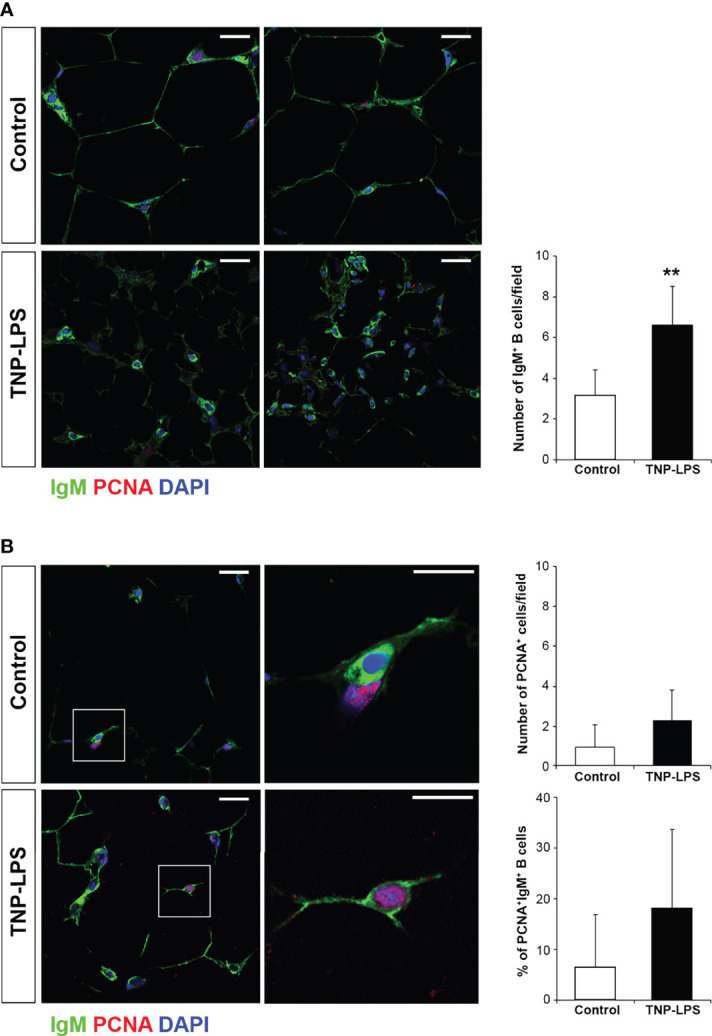
Figure 8.

Proliferation of IgM+ B cells in AT cells after the intraperitoneal immunization of rainbow trout with TNP-LPS. Confocal microscopy images of rainbow trout AT sections obtained from fish intraperitoneally immunized with the antigen TNP-LPS and mock immunized (control) at day 21 post-immunization. Sections were labeled with anti-IgM (green) in combination with the anti-proliferating cell nuclear antigen (PCNA) (red). All sections were also counterstained with DAPI (blue). (A) Representative images for each condition are shown (scale bars = 20µm) along with a graph showing the mean number of IgM+ B cells in immunized fish compared to control fish, calculated in 15 digital fields (400 x magnification) from 6 different individuals (mean + SD; n = 6 fish). Asterisks denote significantly different values between indicated groups (**p ≤ 0.01). (B) Representative images for each condition are shown (scale bars = 20µm) along with higher magnification images from control and TNP-LPS immunized tissues (white square; scale bar = 5 µm). Note that in non-proliferating cells, nuclei appear blue whereas they appear violet in proliferating cells. Graphs showing the mean number of total PCNA+ proliferating cells as well as the mean percentage of proliferating IgM+/PCNA+ cells in immunized fish compared to those in control fish are also included, calculated in 15 digital fields (400 x magnification) from 6 different individuals (mean + SD; n = 6).
