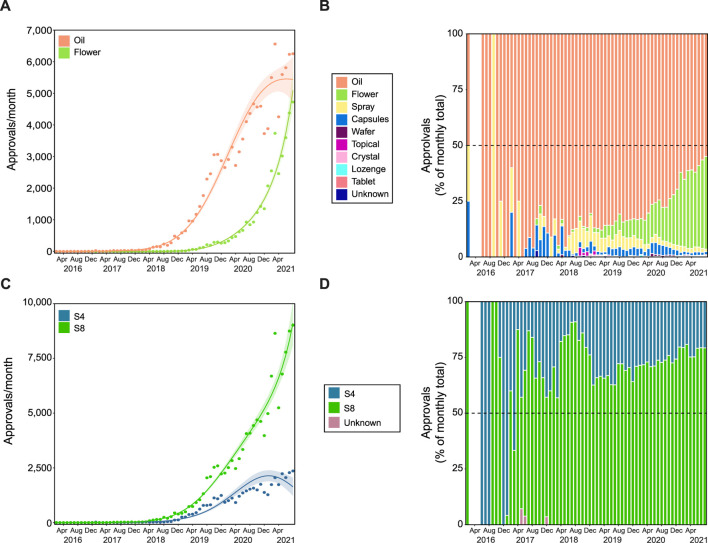
FIGURE 4.
Flower and Schedule 8 products have disproportionate growth. Growth trends in product format (A,B) and product schedule (C,D). Approvals for oil products followed a Negative binomial 4th degree polynomial curve (R2 = 0.980, Δm = 18.292), while approvals for flower followed a Negative binomial 3rd degree polynomial curve (R2 = 0.991, Δm = 8.267). The proportion (%) of approvals per product category (see legend) are shown in panel (B). Approvals for S4 and S8 products followed Negative binomial 4th degree polynomial curves (C; R2 = 0.934 and 0.987, and Δm = 11.691 and 15.707, respectively). The proportion (%) of approvals per product schedule (see legend) are presented in panel (D). The gap (between February 2016 and June 2016 in panels (B) and (D), indicates no applications submitted in this period. In panels (A) and (C) Solid lines represent best fit with shaded standard error of the mean.

