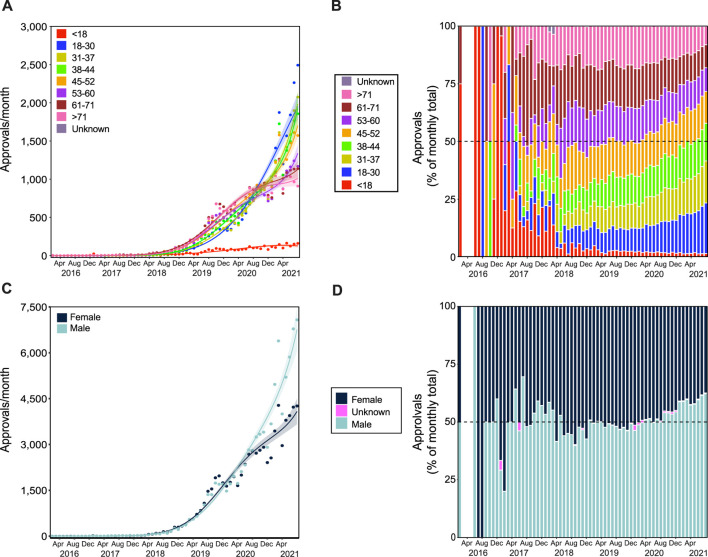
FIGURE 5.
Patient demographics for SAS-B approvals. Growth trends in age groups (A,B) and in patient genders (C,D). Approvals for patients younger than 18 years and between 31 and 37 years of age followed a Negative binomial 3rd degree polynomial curve (R2 = 0.888 and 0.993, and Δm = 6.750 and 22.056, respectively); approvals for patients between 18 and 30 years of age followed a Negative binomial 2nd degree polynomial curve (R2 = 0.986, and Δm = 58.345); approvals for patients in age groups 38 to 44, 45 to 52, 53 to 60, 61 to 71, and over 71 years of age followed a Negative binomial 4th degree polynomial curve (R2 = 0.990, 0.990, 0.991, 0.985, and 0.989, and Δm = 10.929, 16.765, 10.162, 27.937, and 8.374, respectively). Panel (B) shows the proportion of approvals for each age category (see legend) per month. Approvals for females and males followed Negative binomial 4th degree polynomial curves (C; R2 = 0.986 and 0.989, and Δm = 32.522 and 16.797, respectively). The proportion (%) of approvals by patient gender per month are shown in panel (D). Solid lines in panels (A) and (C) represent best fit with shaded standard error of the mean. The gap (between February 2016 and June 2016 in panels (B) and (D), indicates no applications submitted in this period.

