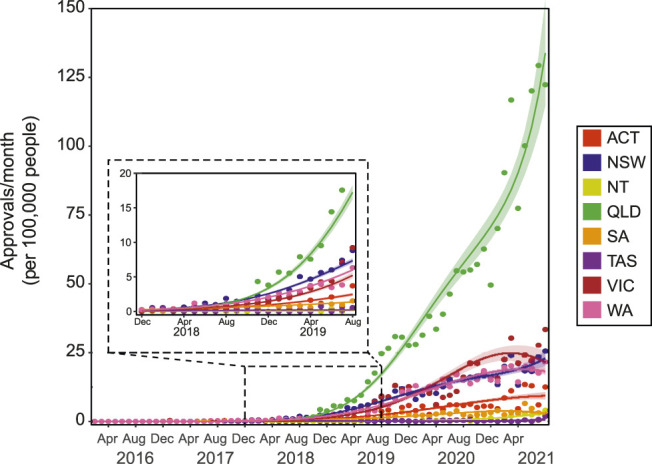
FIGURE 6.

SAS-B approvals across states and territories. The number of SAS-B approvals per month across states and territories represented as per 100,000 persons. Approvals from the Northern Territory (NT) followed a Poisson 1st degree polynomial curve (R2 = 0.772). Approvals from Australian Capital Territory (ACT) and Western Australia (WA) followed Negative binomial, 2nd degree polynomial curves (R2 = 0.926 and 0.986, and Δm = 24.998, and 1,525.398, respectively). Approvals Victoria (VIC) followed a Negative binomial, 3rd degree polynomial curves (R2 = 0.934, Δm = 11.759). Approvals New South Wales (NSW), Queensland (QLD) and South Australia (SA) followed Negative binomial, 4th degree polynomial curves (R2 = 0.982, 0.986, and 0.926, and Δm = 6.783, 73.955, and 4.143, respectively). Approvals from Tasmania (TAS) moderately followed a Negative binomial, 3rd degree polynomial curve (R2 = 0.402, Δm = 2.611). Solid lines represent best fit with shaded standard error of the mean.
