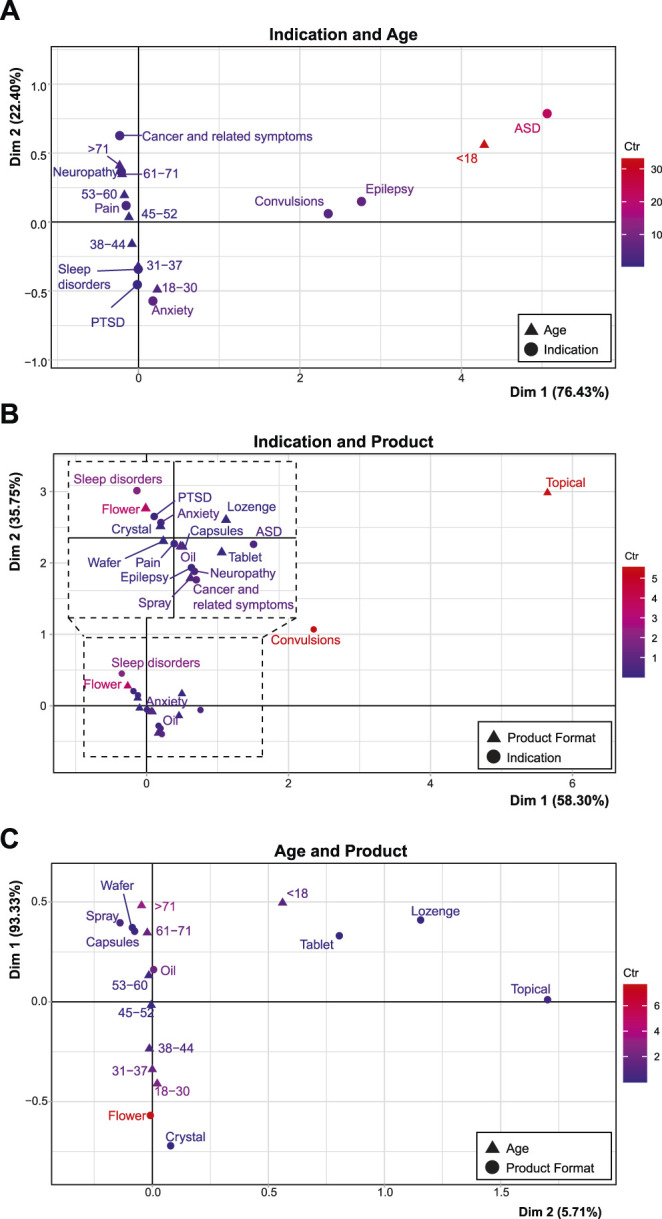
FIGURE 7.

Associations between age, product format, and indication. Correspondence analyses with groups of age compared with indication (A), indication compared with product preference (with an inset representing an expanded view of the dashed area; (B), and age compared with product preference (C). Description of deviation from independence is labelled with the according axes, while the red to blue color gradient indicates the scaled contribution of these factors to the overall variance (the inertia*100; “Ctr”) for each graph. The maximum inertia*100 are 33.07, 8.47, and 5.56, respectively. See Supplementary Tables S3–S5 for the contribution of variance related to these graphs.
