Figure 7.

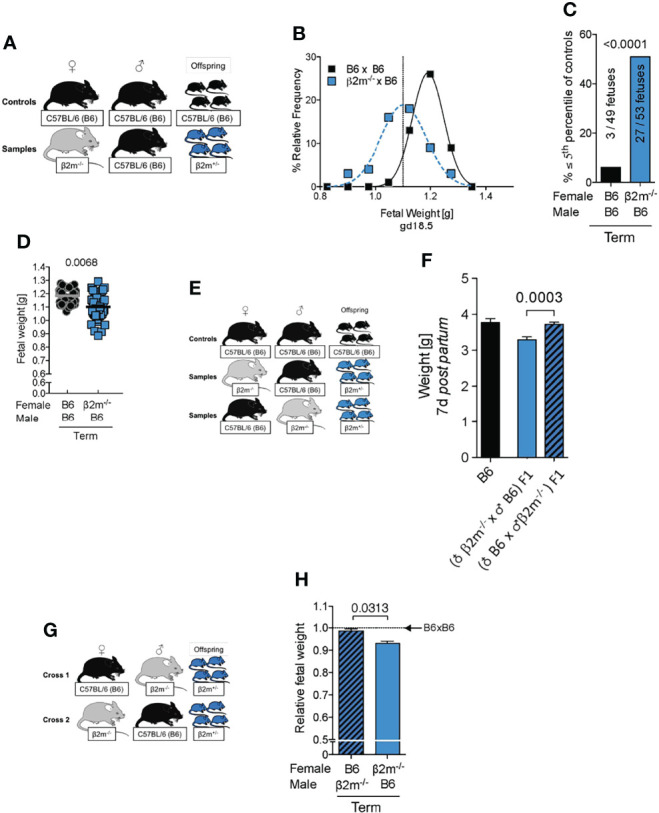
Fetal growth restriction in pregnancies where mothers lack MHC class I molecules. (A) Mating strategy to assess the impact of maternal MHC class I expression on fetal growth. (B) Weight distribution of fetuses carried by females with or without MHC class I surface expression. Dashed vertical line demarcates 5th percentile of B6 controls. (C) Categorical analysis of fetuses within or below the 5th percentile of controls. P-value from Fisher’s exact test. (D) Comparison of mean fetal weights. P-values from a mixed model analysis taking into account the clustering of observations by gestational age and/or litter. P-values above data points are indicative of comparison between crosses on the given time point. (B-D) data representative of 42 – 59 fetuses from 6 – 8 litters per time point per cross. (E) Mating strategy to assess the effect of maternal MHC class I surface expression on post partum growth of isogenic offspring compared to homozygous wildtype controls. (F) Comparison of weight on post partum day 7 between isogenic F1 fetuses with maternal or paternal β2m-/- compared to wildtype B6 controls. Means ± SEM, data representative of 17 – 54 pups per group from 4 – 7 litters. P-value from an unpaired two-tailed Student’s t-test. (G) Mating strategy to control for fetal genotype. (H) Comparison of isogenic fetuses carried by females with or without MHC class I surface expression relative to B6 controls. n = 46-68 fetuses from 7 – 9 litters per group. Fetal weight measured at term. P-value from a mixed model analysis taking the clustering of observations by litter into account.
