Figure 1.
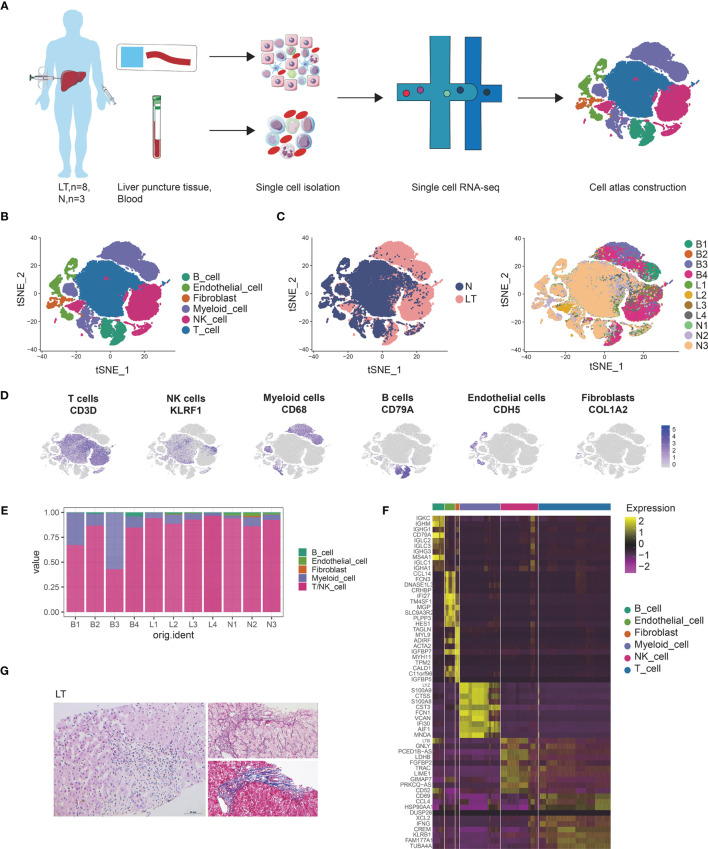
Single cell atlas of human liver transplantation. (A) Schematic diagram of scRNA-seq analysis workflow. (B) tSNE plots for cell type identification of 68,174 high-quality cells. (C) tSNE plot colors by spatial distribution of cells in normal (N) and liver transplantation (LT) tissues. (D) Expression of canonical cell markers including CD3D, KLEF1, CD68, CD79A, CDH5, and COL1A2. (E) Barplots showing the proportion of cell types in each sample. (F) Heatmap showing the top 10 genes of each cell type. (G) HE, Masson, and reticular staining of liver transplantation samples.

