Figure 5.
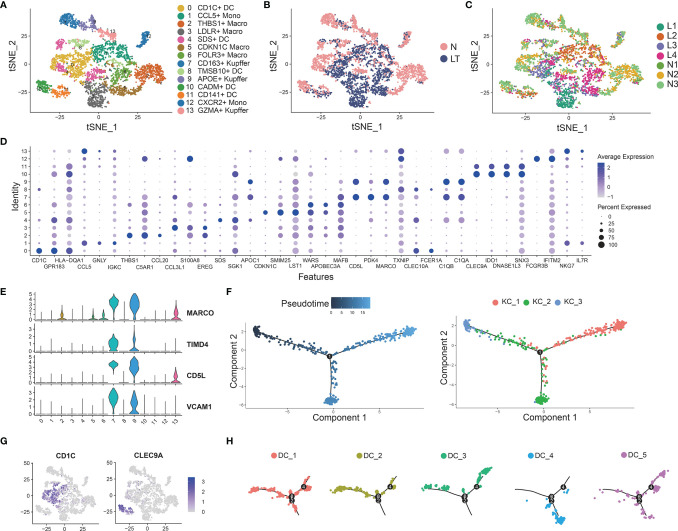
Identifying myeloid cell subpopulations in liver tissue. (A) Clustering of 4883 myeloid cells and cell annotation. (B) tSNE plots colors by spatial distribution of cells in normal (n=3) and liver transplantation (n=4) human tissues. (C) tSNE plots colors by spatial distribution of cells in 7 samples. (D) Dotplots of each cluster of myeloid cells’ top 5 marker genes. (E) Gene expression of Kupffer cells’ canonical markers across myeloid cells. (F) Pseudotime analysis with identified 3 Kupffer groups. (G) Gene expression of dendritic cells’ canonical markers across myeloid cells. (H) Pseudotime analysis with 5 dendritic cell groups.

