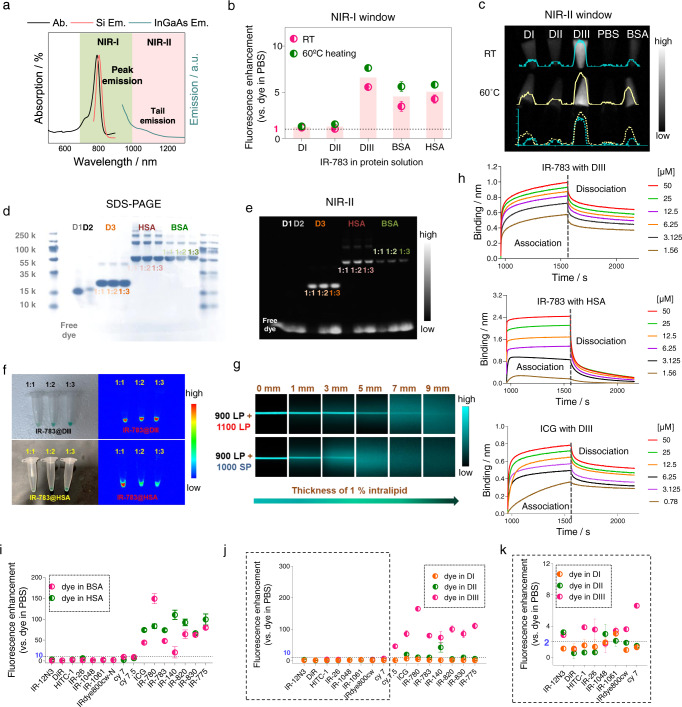
Fig. 2. Fluorescence enhancement of cyanine dyes complexed with DIII.
a Absorption, NIR-I emission, and NIR-II emission spectra of IR-783@DIII. Ab.: absorption spectrum; Si Em.: emission spectrum recorded using a silicon camera; InGaAs Em.: emission spectrum recorded using an InGaAs camera. b, c Fluorescence enhancement of IR-783@DIII (1:1) at room temperature (RT) and 60 °C in the NIR-I (b) and NIR-II (c) regions (n = 3). d, e Electrophoresis analysis of mixtures of IR-783 with DI, DII, DIII, HSA, and BSA (10 min post-heating at 60 °C) under white light (d) and ˃1100 nm fluorescence (e) imaging. f NIR-II images of IR-783@DIII and IR-783@HSA with various protein-to-dye molar ratios. g Fluorescence images of capillaries filled with IR-783@DIII solution immersed in 1% intralipid to varying depths. h Kinetic binding assay results of IR-783 with DIII (top) or HSA (middle) and ICG with DIII (bottom). i–k Fluorescence enhancement of various cyanine dyes complexed with BSA or HSA (i) and DI, DII, or DIII (j) compared with free dye in PBS. The results for the probes outlined with a dashed line in (j) are enlarged in (k) (n = 3). Data are presented as mean ± s.d. of three independent experiments.

