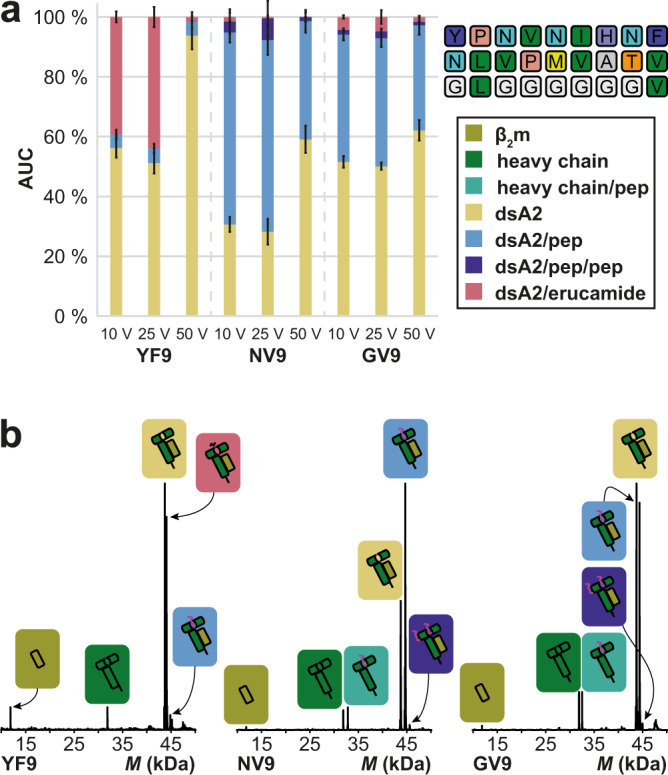
Fig. 2. Overall area under the curve (AUC) for the detected dsA2 mass species in presence of YF9, NV9, and GV9 at different acceleration voltages.

a The AUC is determined over the entire spectrum for the respective mass species at 10, 25, and 50 V. The cone voltage is kept constant at 150 V. The mean value of the AUC in the absence or presence of the different peptides (protein–peptide ratio 1:5) from at least three independent measurements is depicted along with error bars that represent the corresponding standard deviation. “dsA2” corresponds to the empty HLA-A*02:01(Y84C/A139C) disulfide mutant complex, “dsA2/pep” to dsA2 bound to one peptide, “dsA2/pep/pep” to dsA2 bound to two molecules of this peptide, and “dsA2/erucamide” to dsA2 bound to erucamide, respectively. The negative control YF9 barely associates with dsA2, whereas the positive control shows a high proportion of dsA2/NV9, indicating high affinity. GV9, which contains only the two anchor residues Leu-2 and Val-9 of NV9, still shows a high affinity, and at 50 V, their dsA2/pep proportions are very similar, showing that their gas-phase stability is comparable. b Representative charge-deconvoluted spectra of the distinct protein and protein–peptide complex species recorded at 25 V. Olive and dark green correspond to the free β2m domain and heavy chain, respectively. Teal corresponds to a free heavy chain still attached to a peptide. The different complexes are assigned in yellow (empty dsA2), coral (dsA2/erucamide), light blue (dsA2/pep), and dark blue (dsA2/pep/pep).
