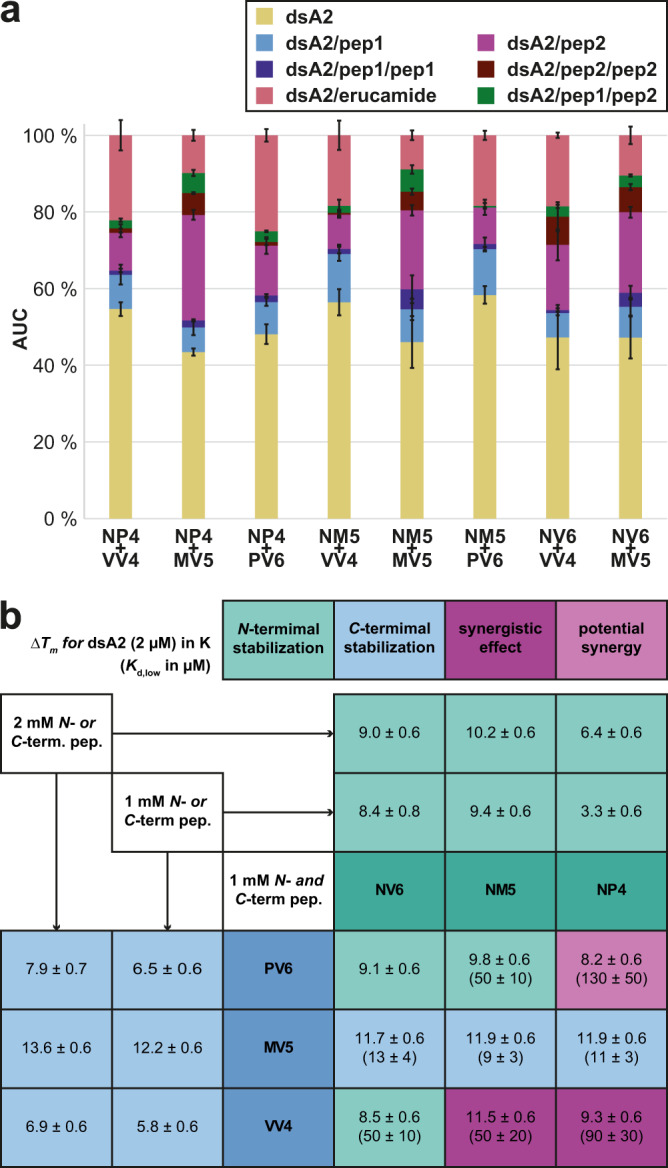
Fig. 7. Detected dsA2 mass species in presence of two corresponding truncated NV9 variants.

a The native MS data suggest that the truncated peptides do not bind cooperatively as the amount of dsA2/pep1/pep2 remains small in all measurements. Rather, the affinity of the individual peptides is independent of each other. The AUC is determined over the entire spectrum for the respective mass species at 10 V. The mean value of the AUC in the absence or presence of the different peptides (protein–peptide ratio 1:10:10) from at least three independent measurements is depicted along with error bars that represent the corresponding standard deviation. “dsA2” (yellow bars) corresponds to the empty HLA-A*02:01(Y84C/A139C) disulfide mutant complex, “dsA2/pep” (light blue bars) to dsA2 bound to one peptide, “dsA2/pep/pep” to dsA2 bound to two molecules of this certain peptide (dark blue bars), “dsA2/pep2” to dsA2 bound to another peptide when two different peptides were present (purple bars), “dsA2/pep2/pep2” to dsA2 bound to two molecules of the second peptide (dark red bars), “dsA2/pep1/pep2” to dsA2 bound to one molecule of each of both peptides (dark green bars) and “dsA2/erucamide” to dsA2 bound to the erucamide (coral bars) respectively. The corresponding Kd,low is shown for respective peptide pairs in (b). b The matrix visualizes the changes of Tm in case half of the peptide amount is either exchanged for the corresponding N- (teal) or C-terminal (blue) peptide respectively or alternatively omitted. Teal marks the occurrence of major N-terminal stabilization whereas, for the light blue cells, the complex is primarily stabilized by the C-terminal peptide. Purple cells show peptide coupling with a significant synergistic effect or potential synergy (light purple).
