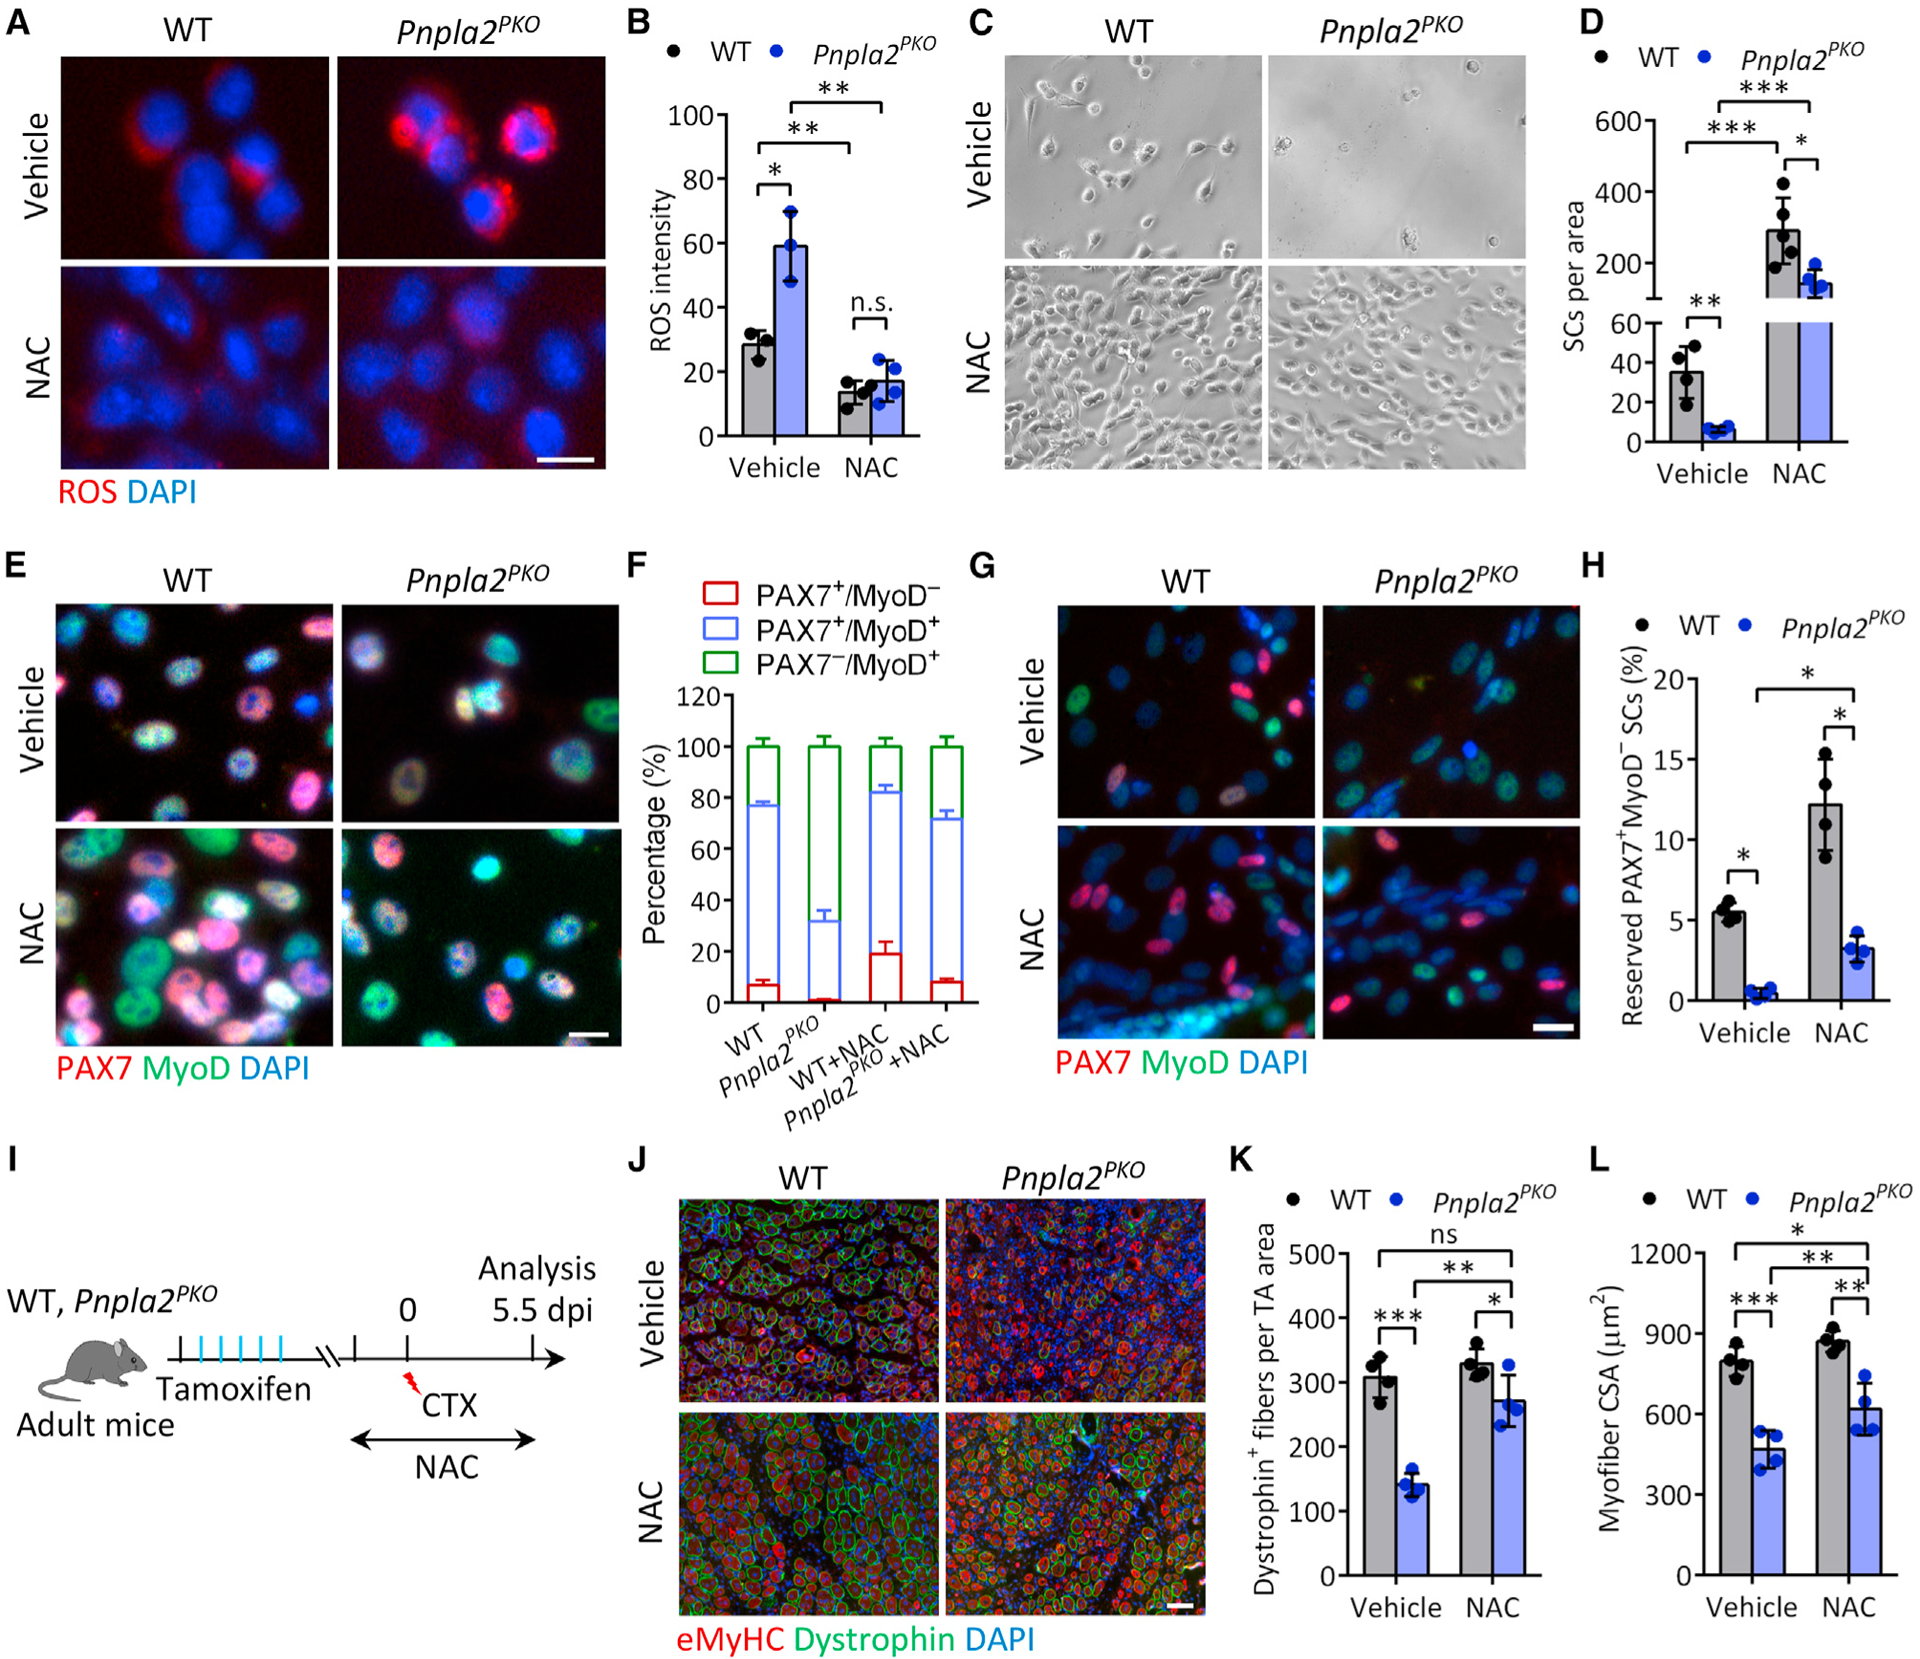
Figure 7. Reducing oxidative stress rescues cell fate commitment and regenerative deficiency of ATGL-deficient SCs.

(A and B) Representative ROS staining (A) and quantification of ROS level (B) in FACS-sorted SCs from WT and Pnpla2PKO mice. SCs were cultured for 4 days with or without 5 mM NAC. Vehicle: n = 3 mice, NAC: n = 4 mice. Scale bar, 10 μm.
(C and D) Representative cell growth image (C) and quantification of SC number (D) after NAC treatment. FACS-sorted SCs from WT and Pnpla2PKO mice were cultured for 4 days with or without 5 mM NAC. Vehicle: n = 4 mice, NAC: n = 5 mice.
(E and F) Immunostaining of PAX7 and MyoD (E) and quantification of SC population (F) in WT and Pnpla2PKO cultured muscle cell mixtures treated with 5 mM NAC (n = 3 mice). Scale bar, 10 μm.
(G and H) Immunostaining of PAX7 and MyoD (G) and quantification of quiescent (PAX7+/MyoD−) SCs reserved in cultures (H) upon 2 days differentiation (n = 4 mice). Scale bar, 10 μm.
(I) Experimental scheme for NAC treatment and CTX injury in WT and Pnpla2PKO mice.
(J–L) Immunostaining of eMyHC and dystrophin (J) and quantification of the number (K) and CSA (L) of dystrophin+ myofiber on TA muscle cross-sections at 5.5 dpi after NAC treatment (n = 4 mice). Scale bar, 50 μm.
Data are mean ± standard deviation; Student’s t test. *p < 0.05, **p < 0.01, ***p < 0.001. n.s., not significant. See also Figure S7.
