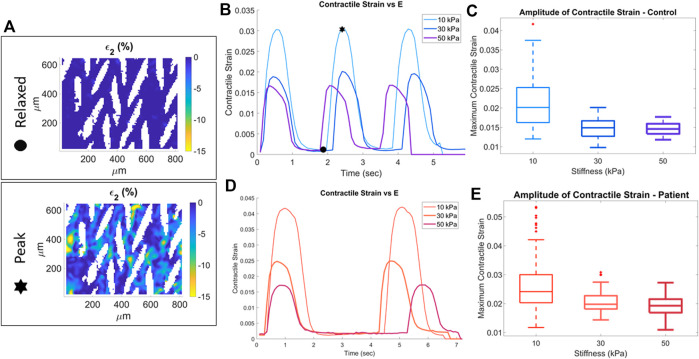
FIGURE 2.
Quantification of contractile strain for control (blue) and patient (red) cell lines. Stars indicate relaxed state and peak contraction of a sample on a 10 kPa substrate. The full-field second principal strain for these two states is shown in the strain heatmaps (A). Representative samples at each substrate stiffness for control (B) and patient (D) cell line. The maximum contractile strain for the three substrate stiffness conditions for the control (C) and patient (E) cell lines.

