FIGURE 3.

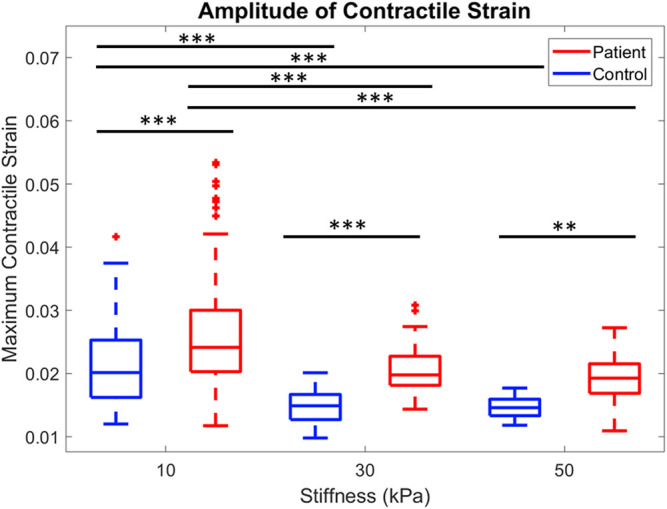
Comparison of peak contractile strain for control and patient across all three substrate stiffnesses are shown. **p < 0.001, ***p < 0.0001, one-way ANOVA with post hoc Tukey tests.

Comparison of peak contractile strain for control and patient across all three substrate stiffnesses are shown. **p < 0.001, ***p < 0.0001, one-way ANOVA with post hoc Tukey tests.