FIGURE 6.
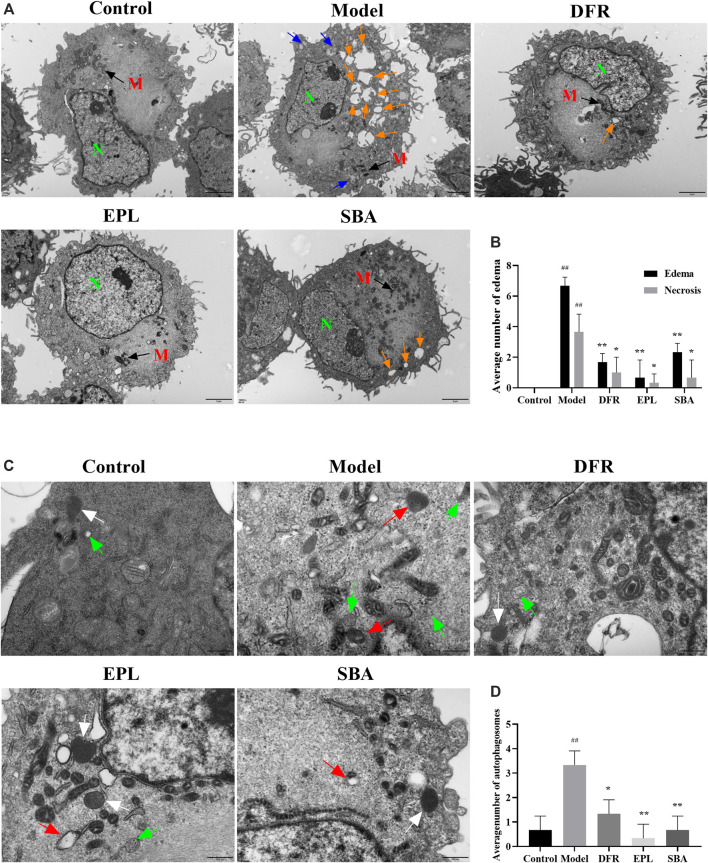
TEM observation results. (A) Scale bar: 2 μm. Orange arrow: edema; blue arrow: necrosis. N, nucleus; M, mitochondria. (B) Number of edema and necrosis in different groups is presented as bar graphs. (C) Scale bar: 500 nm. Green arrow: autophagosomes; white arrow: lysosomes; red arrow: autolysosome. (D) Quantification of the autophagosomes in different groups is presented as bar graphs. The figures are representative images of three different samples. SBA group dose 25 μg/ml n = 3 per group. #p < 0.05, ##p < 0.01 vs. control, *p < 0.05, **p < 0.01 vs. model.

