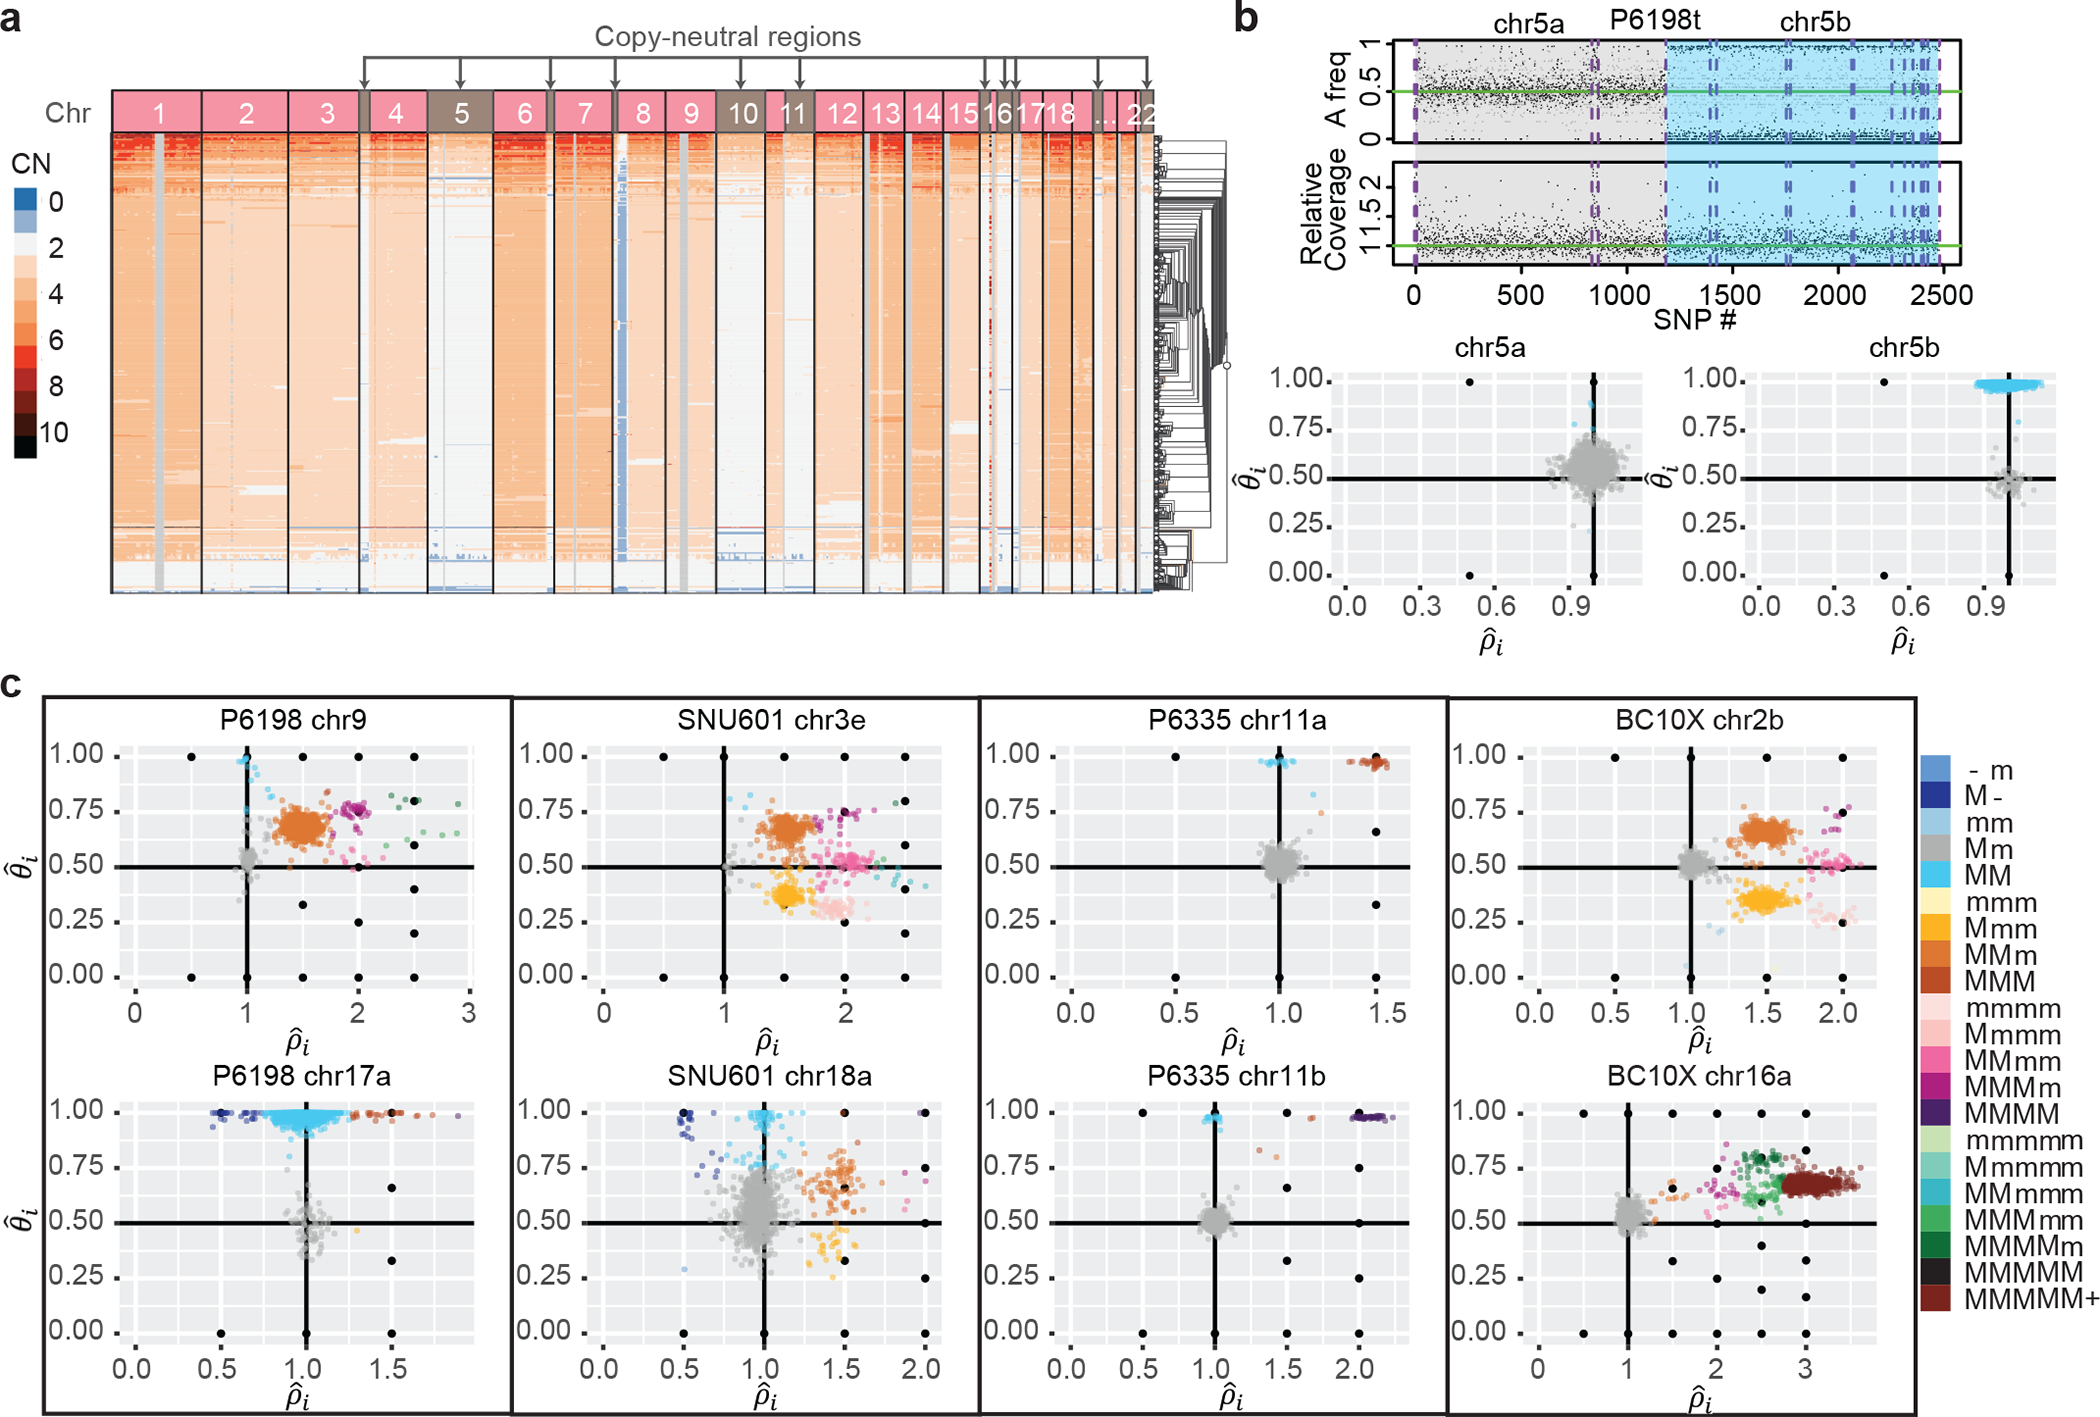
Fig. 3: Across multiple cancer types, Alleloscope detects loss-of-heterozygosity events and multi-allelic copy number aberrations, delineating complex subclonal structure which are invisible to total copy number analysis.

(a) The Cell Ranger hierarchical clustering result for P6198t with copy-neutral regions labeled (total 512 cells). (b) Top: FALCON segmentation of P6198 chr5 into two regions with different allele-specific copy number profiles. Bottom: Detailed haplotype profiles of the two regions from Alleloscope, showing that the first region is diploid across cells and the second region has a loss-of-heterozygosity for a subpopulation of cells. The a and b following the chromosome number denote two ordered segments. (c) Single-cell allele-specific estimates , colored by assigned haplotype profiles, for select regions in the samples P6198t (metastasized colorectal cancer sample), SNU601 (gastric cancer cell line), P6335 (colorectal cancer sample), and BC10X (breast cancer cell line). In the color legend, M and m represent the “Major haplotype” and “minor haplotype” respectively. The lower-case letters following the chromosome number in the titles denote the ordered genomic segments.
