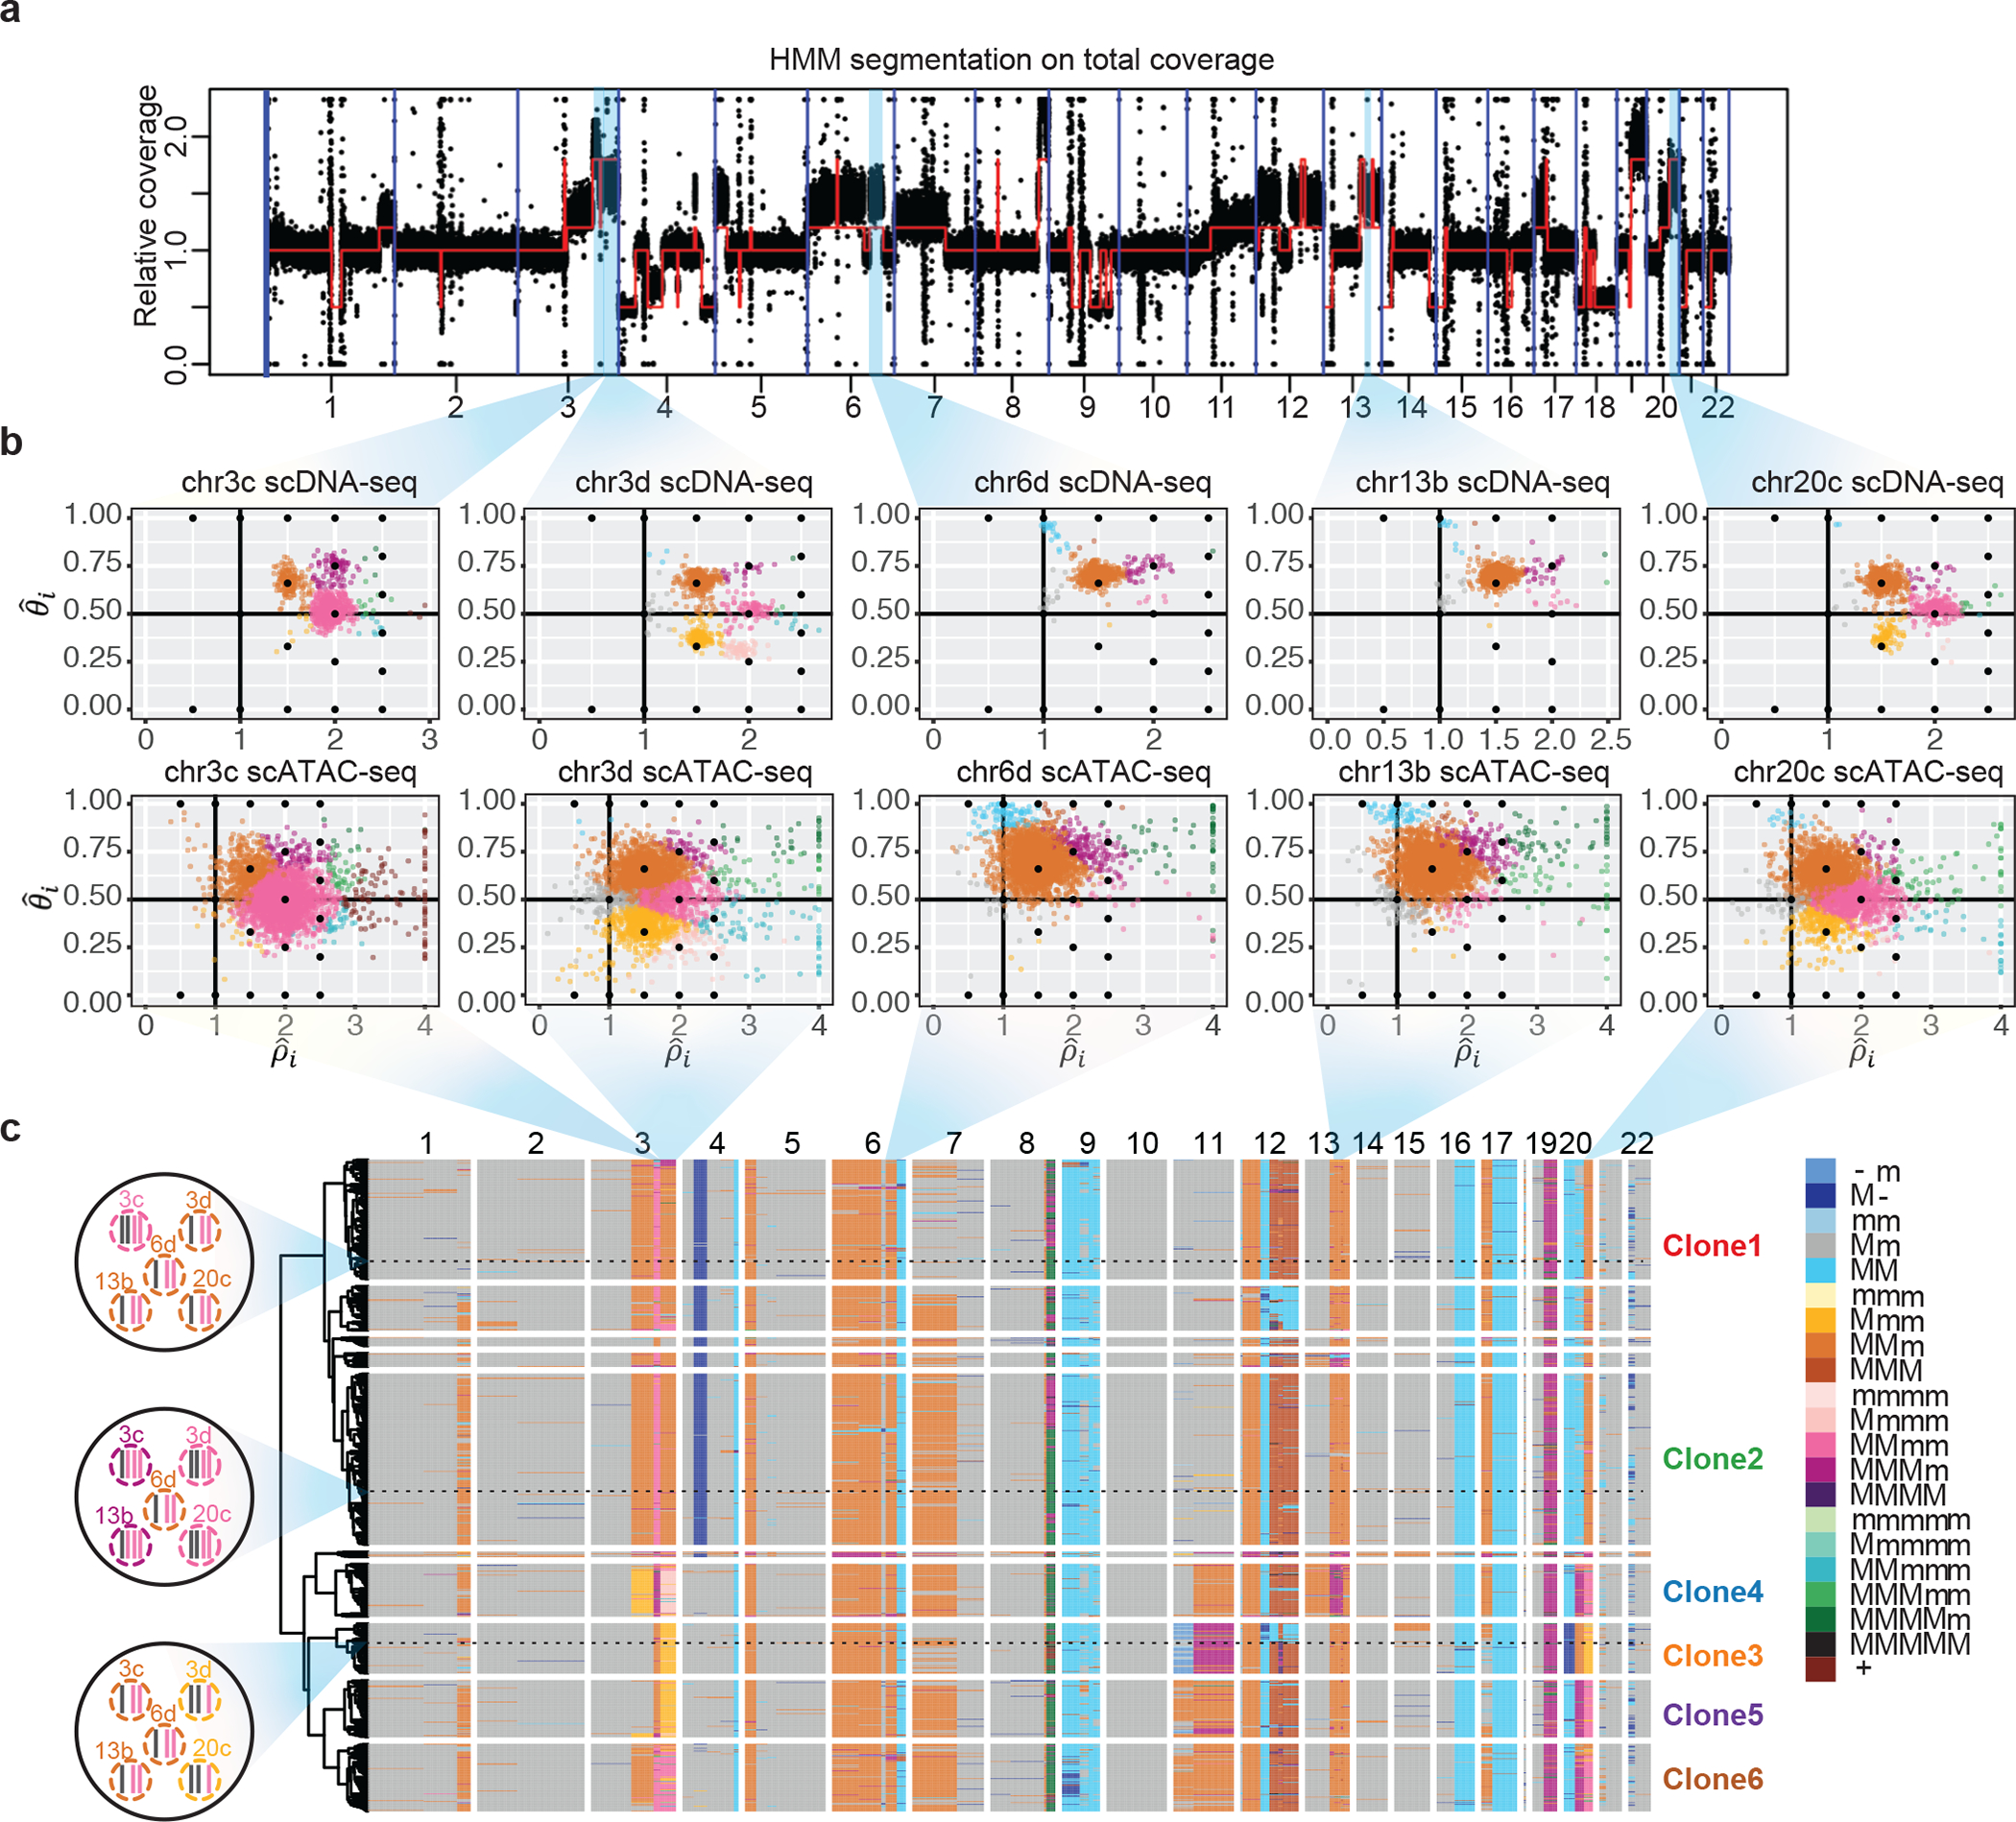
Fig. 5: Alleloscope analysis of scDNA-seq and scATAC-seq data reveals complex subclonal heterogeneity in the SNU601 gastric cancer cell line.

(a) Genome segmentation using HMM on the pooled total coverage profile computed from scDNA-seq data. (b) Single-cell allele-specific copy number profiles () for five regions in scDNA-seq and scATAC-seq data. Cells are colored by haplotype profiles according to legend in Fig. 5c. (c) Tumor subclones revealed by hierarchical clustering of allele-specific copy number profiles from the scDNA-seq data. Genotypes of the five regions shown in Fig. 5b, for three example cells, are shown in the left. The haplotype structures for the 5 regions in Fig. 5b of three cells randomly chosen from Clone 1, 2, and 3, are shown to the left of the heatmap. In the color legend, M and m represent the “Major haplotype” and “minor haplotype” respectively. The six clones selected for downstream analysis in scATAC-seq data are labeled in the plot.
