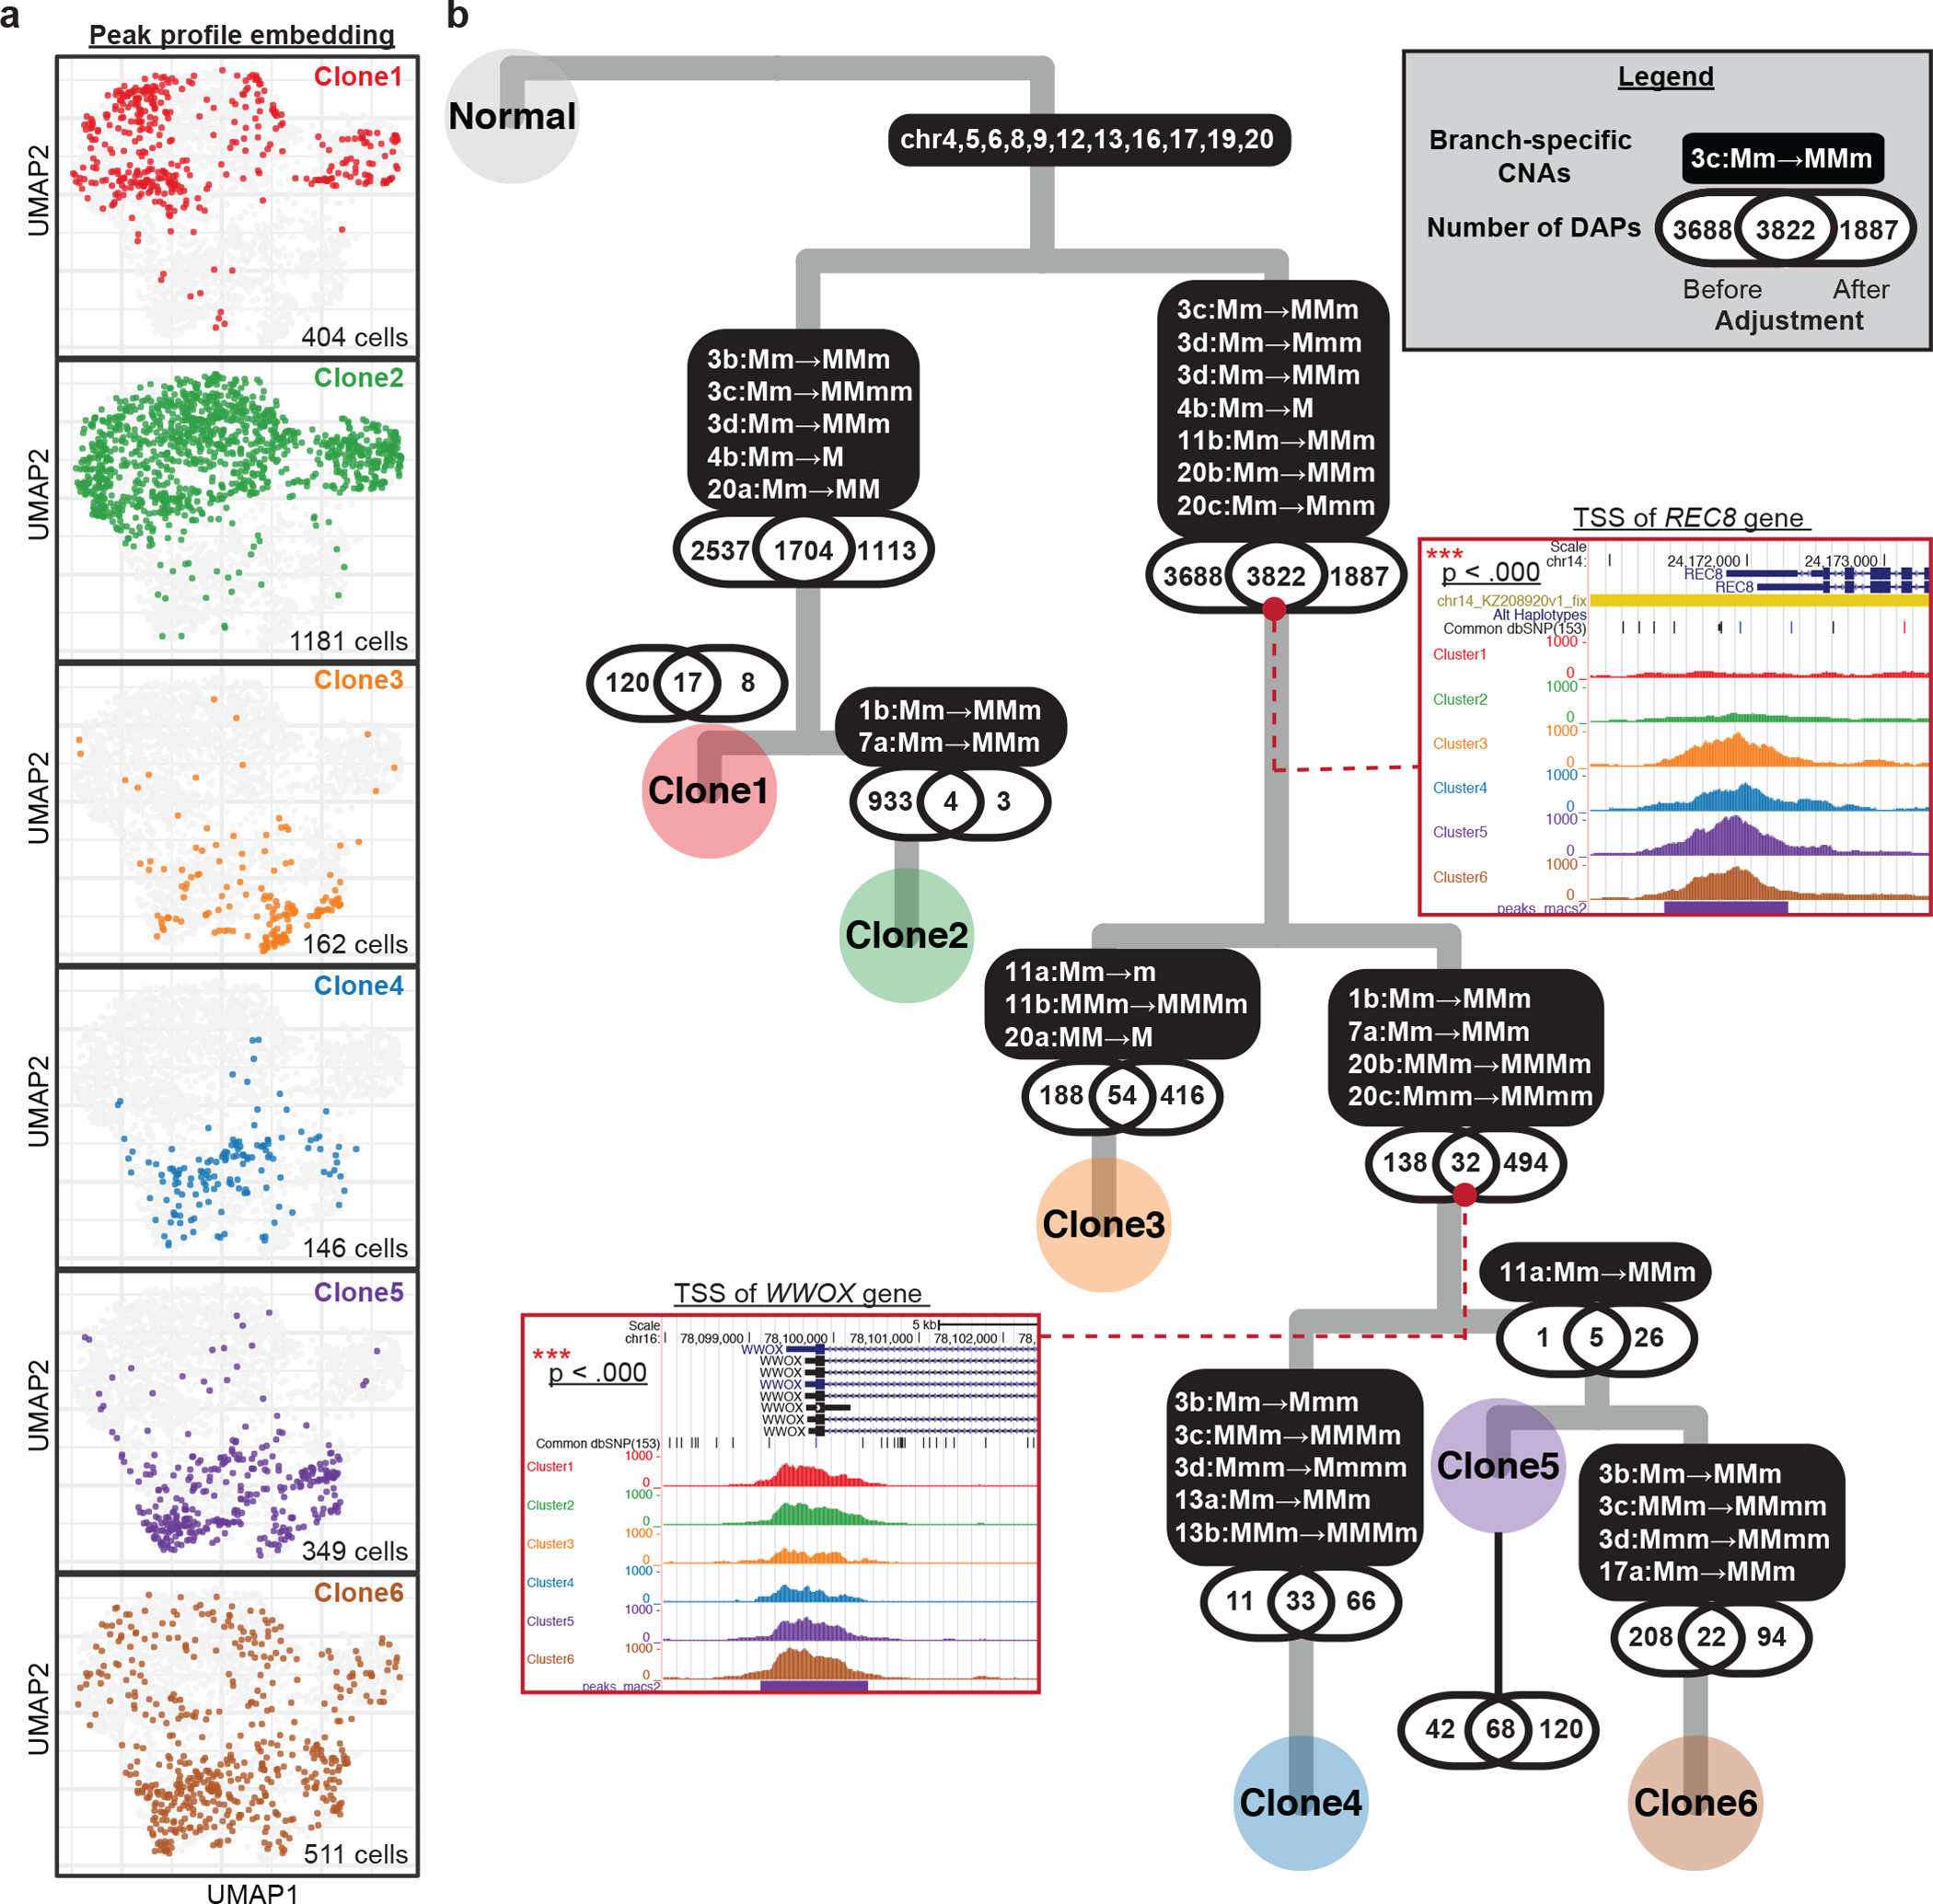
Fig. 6: Integrative analysis of allele-specific copy number and chromatin accessibility for SNU601 ATAC sequencing data.

(a) UMAP projection of genome-wide scATAC-seq peak profile on 2,753 cells. The same group of cells were clustered into one of the six subclones based on their allele-specific copy number profiles across the 10 selected regions. Cells in different subclones are labeled with different colors, using the same color scheme as that for the subclone labels in Fig. 4c. The number of cells colored in each UMAP is shown at the bottom-right corners. (b) A highly probable lineage history of SNU601, with copy number alterations (CNAs) and differentially accessibility peaks (DAPs) marked along each branch. P-values of the tests for association between DAPs and CNAs are shown along each branch. For two example DAP genes, pooled peak signals for each subclone are shown as inset plots.
