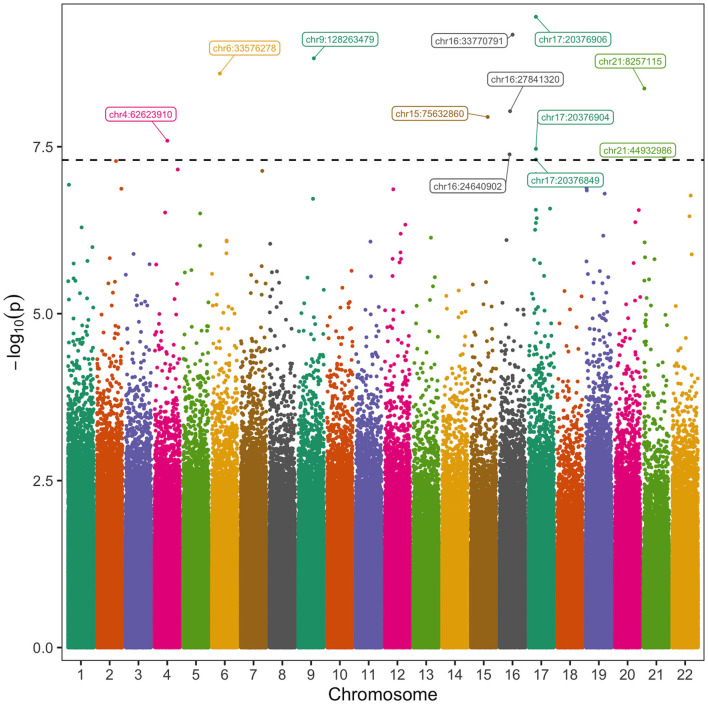
Figure 2.
Manhattan Plot of CpGs Associated with Post-operative Atrial Fibrillation. The vertical axis represents the negative log 10 of the p-value of each CpG's association with POAF. The horizontal axis represents the chromosome and position of each CpG. Twelve CpGs had significant association with POAF after controlling for known clinical and methylation covariates. The black horizontal dashed line corresponds to a p-value of 5 × 10⁻⁸.

