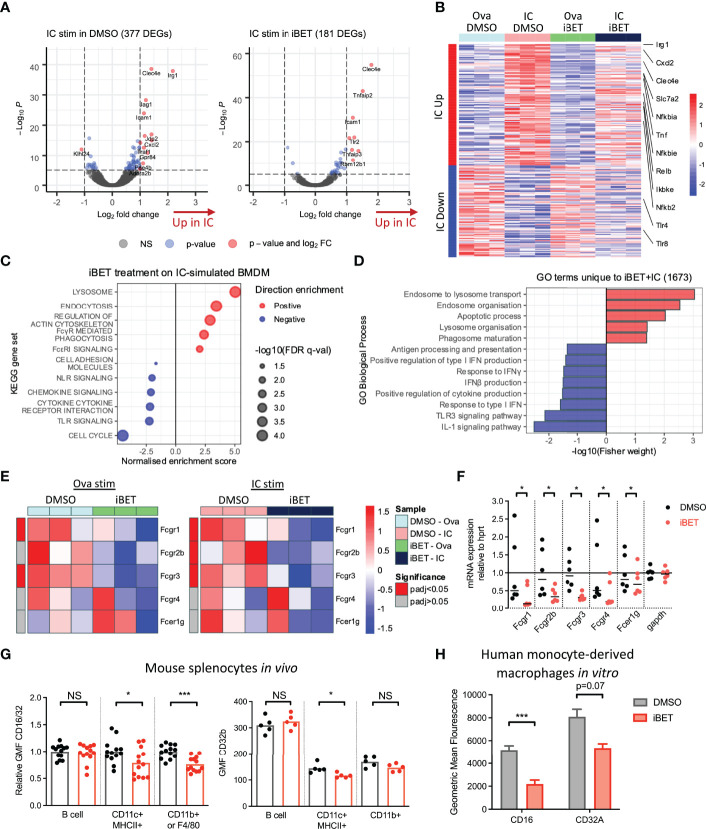
Figure 1.
Gene expression changes induced by FcγR crosslinking are variably affected by iBET. (A) Volcano plots demonstrating DEGs stimulated by Ova-IC vs ovalbumin control, in the absence and presence of iBET, in murine BMDMs. (Adjusted P-value cut-off = 10e-6.) (B) Heat map of top 200 IC-induced DEGs with iBET treatment, with genes of interest involved in inflammatory signalling highlighted. (C) Gene set enrichment analysis (GSEA) of selected KEGG pathways affected by iBET treatment in IC-stimulated BMDMs; all FDR q-value < 0.05. (D) GO biological processes of DEGs unique to combination of IC stimulation and iBET treatment. (E) Heat map of Fcgr expression in BMDMs following iBET treatment, with Ova or Ova-IC stimulation. (F) qPCR of Fcgr expression in BMDMs following iBET treatment. Medians are shown, where points represent expression levels of BMDMs from individual mice (n=6). (G) Flow cytometry quantification of FcγR expression on splenic B cells, dendritic cells (DC) and macrophages in vivo, following systemic treatment with iBET for 3 days. Medians are shown for data representative of 4 independent experiments, points represent individual mice. (H) Flow cytometry quantification of FcγR expression on human monocyte-derived macrophages (moMac) in vitro, following treatment with iBET. Means ± SEM shown for data representative of 2 independent experiments from independent donors. BMDM RNA-seq data is representative of 3 biological replicates from independent mice. Significance testing using Wald test as described in DESeq2 (E), Wilcoxon matched-pairs signed rank test (F), Mann-Whitney U test (G), and two-tailed Student’s t-test (H).

