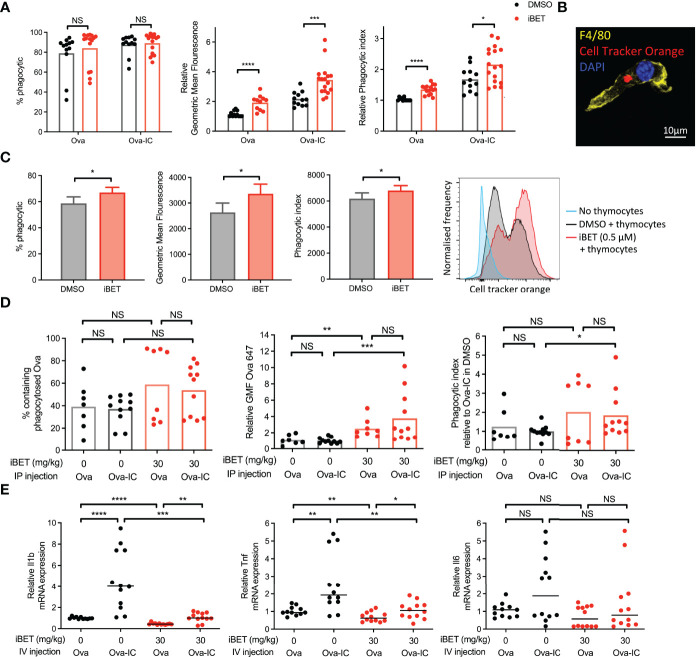
Figure 2.
iBET alters macrophage phagocytosis. (A) Flow cytometry quantification for phagocytosis of fluorescent-labelled Ova-AF647 by murine BMDMs after 16 hours. Phagocytic index is the geometric mean fluorescence (GMF) of Ova+ gate (phagocytic macrophages). Means ± SEM shown for data representative of 5 independent experiments, normalized to DMSO-treated BMDMs in Ova, to allow comparison across experiments. (B) Representative image of murine BMDM with phagocytosed fluorescent-labelled (cell tracker orange) apoptotic thymocytes after 4 hours. (C) Flow cytometry quantification for phagocytosis of apoptotic thymocytes by BMDMs. Means ± SEM shown for data representative of 2 independent experiments. (D) Flow cytometry quantification for peritoneal macrophage accumulation of fluorescent-labelled immune complexed or soluble antigens in vivo. Medians are shown for data representative of 3 independent experiments, points represent individual mice. Relative values to untreated Ova-IC stimulated mice reported due to interexperimental variation in Ova-AF647 fluorescence. (E) qPCR of inflammatory cytokine expression in whole kidney tissue following iBET treatment and IC stimulation. Medians are shown from 2 independent experiments, where points represent expression levels from individual mice. Significance testing using two-tailed Student’s t-test (A, C), Mann-Whitney U test (D, E).

